


Executive Summary
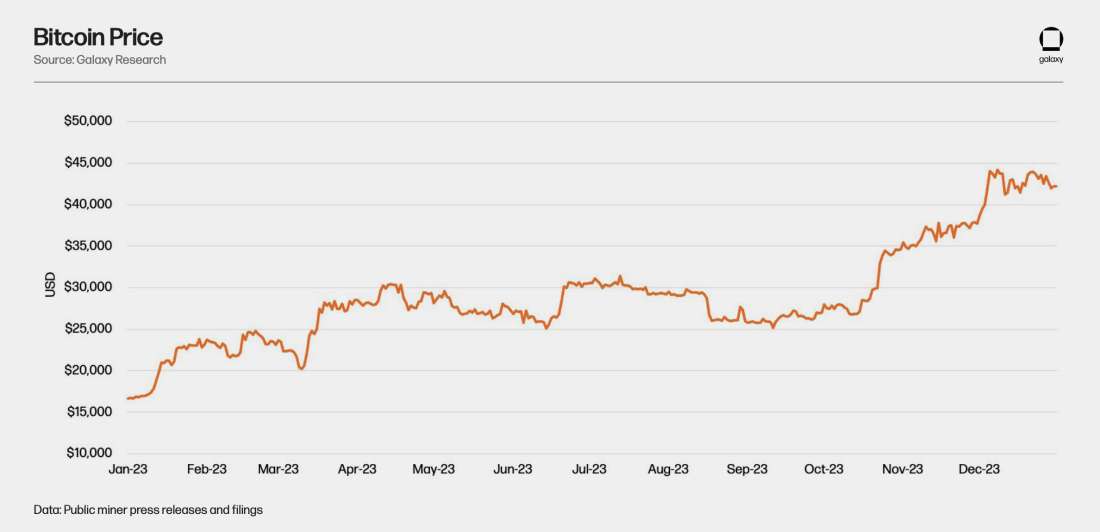
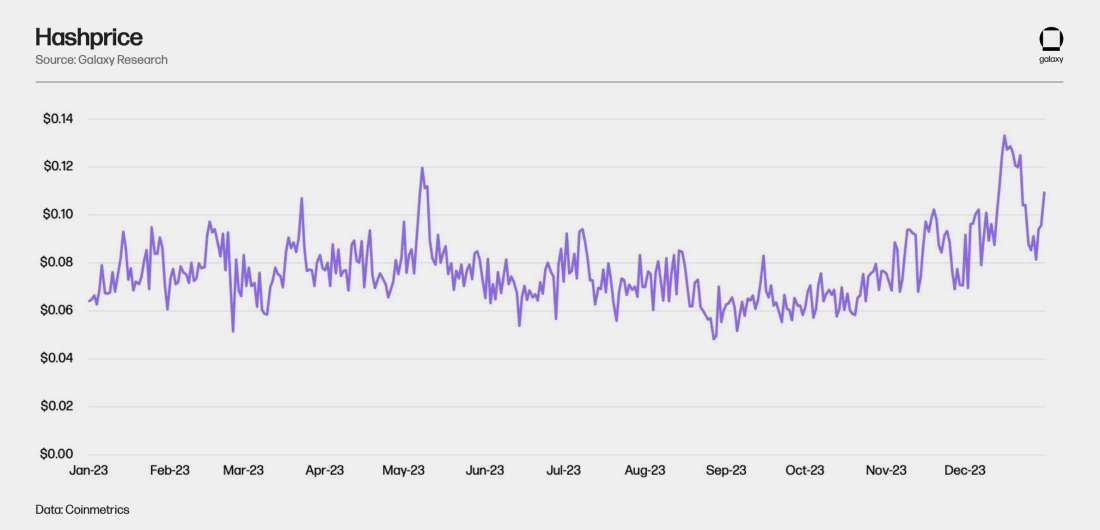
As we wrote a year ago, 2022 was one of the most challenging years for bitcoin miners, as miners faced a perfect storm of headwinds that forced them to cut costs, sell assets, and liquidate their bitcoin treasuries at depressed prices. In contrast, 2023 was a rebound year, highlighted by significant growth in bitcoin price, transaction fees, and network difficulty. Bitcoin’s price rebounded from the low of $16,524 at the end of 2022 to finish the year at $42,217 (+155%), driven largely by the anticipation that a spot Bitcoin ETF would be approved. Transaction fees increased 336% YoY due to the introduction of the ordinals protocol and inscriptions, which has led to the burgeoning development of web3 applications and tokenization on Bitcoin. The combination of rising bitcoin price and transaction fees resulted in a significant improvement in hashprice. Hashprice improvement combined with newer and more efficient ASICs hitting the market, caused significant growth in network difficulty (+104% YoY). Despite the tremendous growth in network difficulty, 7D trailing hashprice still finished the year at $0.095 (+57%). 2023 was also highlighted by a rise in international hashrate from geographies such as the Middle East, South America, Bhutan, China, and Russia. In preparation for the halving, several large miners have utilized equity financing to make significant ASIC purchases to increase the size and improve the efficiency of their fleets. In this report, we delve into each of the major events and trends that have impacted the Bitcoin mining industry in 2023 and provide our outlook and perspectives on the landscape for 2024, including the upcoming fourth halving.
As the title of this report suggests, hashprice volatility is a new frontier that miners will have to master after fine tuning their operations during the bear market. With challenges like the halving and transaction fee instability at the forefront, conquering the Hashfrontier will be paramount for the survival of existing players.
Key Takeaways
Following a tumultuous 2022, miners got a much-needed reprieve in 2023 driven by improvements in bitcoin price, spikes in transaction fees, and the easing of energy prices. Offsetting some of these moves was the meteoric rise in hashrate, which rose 104% in 2023.
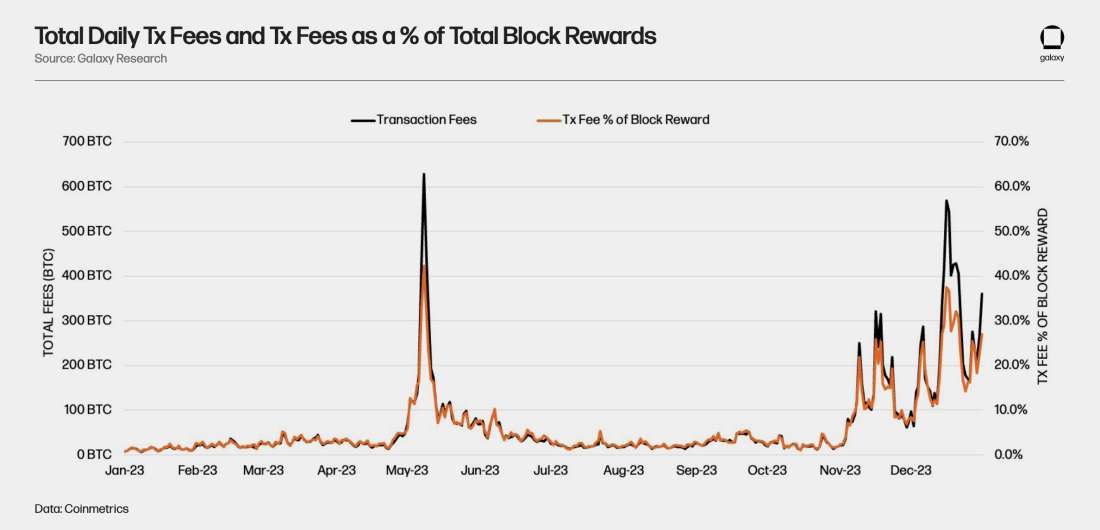
Transaction fees were a massive dark horse in 2023. Transaction fee spikes that occurred periodically in 2023 helped drive miner revenue significantly higher. Transaction fees totalled 23,445 bitcoin in 2023, of which Ordinals transactions contributed 5,000 bitcoin. Fees in 2023 were over 4x the sum of transaction fees in 2022, which totalled 5,375 BTC.
We expect hashprice volatility to increase in 2024 as demand for blockspace ebbs and flows, causing sharp movements in transaction fees, which will lead to further changes in hashrate.
Over the course of the year, public miners purchased over 94 EH worth of machines valued at more than $1.53B. Miners particularly focused on acquiring new generation machines with efficiencies under 20 J/TH to update their fleet ahead of the halving.
We estimate that roughly 15-20% of the network hashrate at the conclusion of 2023 (86-115 EH) could come offline at the time of the halving. Based on our analysis, we expected 2024 network hashrate to end in a range between 675 EH and 725 EH.
In 2023, global mining power costs, primarily influenced by natural gas, remained remarkably stable, especially in the U.S. This contrasted with the volatility in 2022, attributed to Eastern European disturbances. The stability was driven by record-high U.S. natural gas production, surplus inventories, reduced demand due to milder temperatures, and a slight industrial consumption decline, providing miners with a stable energy cost environment leading up to the impending halving event.
Bitcoin miners, facing revenue volatility and heightened reliance on transaction fees, are actively assessing new risk management strategies, including instruments such as hashrate derivatives contracts, to ensure revenue predictability, stability, and to maintain investor confidence.
2023 Year in Review
Network Metrics
Bitcoin Price
Bitcoin price began the year at $16,524 and finished the year at $42,217, a 155% increase. The increase in Bitcoin price throughout 2023 was driven by a few commingling factors:
Base effects emanating from bitcoin’s low start to the year, which was brought by forced selling at the end of 2022 following the collapse of FTX and several prominent bankruptcies
The banking crisis which shed a spotlight on the use cases of Bitcoin
The announcement of several spot Bitcoin ETF filings/re-filings, which drove enthusiasm around immense capital flooding into the asset following the ETF’s approval
The historical price action that has been observed around previous halving events
Transaction Fees
Transaction fees totaled 23,445 BTC in 2023, over 4x the 5,375 BTC paid by users in 2022. The proliferation of inscriptions in 2023, especially activity surrounding the minting and trading of BRC-20s, led to periods of sustained fee pressure in May, November, and December. Fees generated from Ordinals transactions amounted to over 5,000 bitcoin in 2023.
Network Difficulty and Hashrate
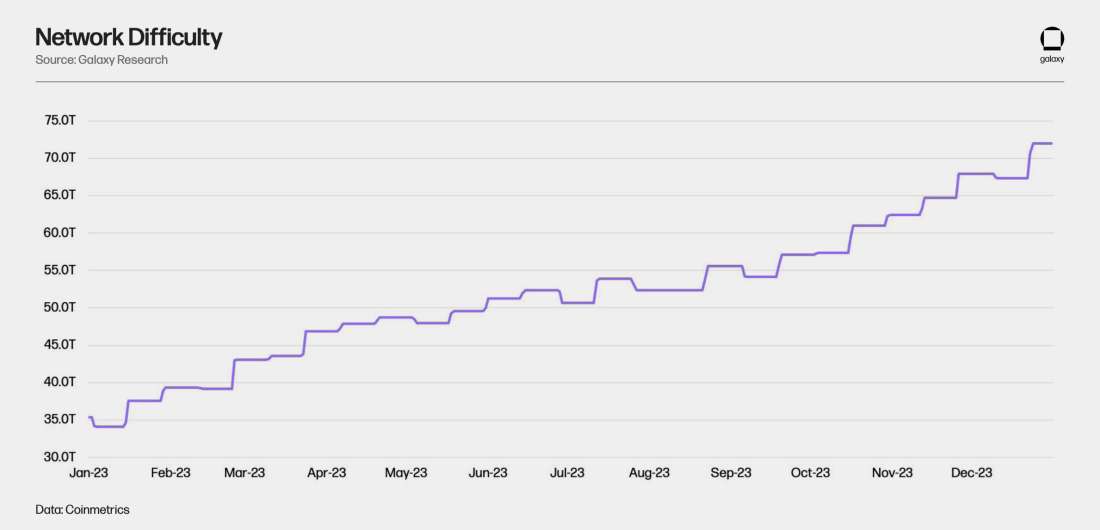
Network difficulty rose from 35.3 T (implied hashrate of 253 EH) to 72.0 T (implied hashrate of 515 EH) in 2023, a 104% increase over the course of the year. The hashrate increase in 2023 far exceeded hashrate growth in previous years. Hashrate increased 45.7%, 30.5%, and 34.8% in 2022, 2021, and 2020, respectively. Several tailwinds drove hashrate higher this year, some of which we outlined in our 2023 Mid-Year Report, including:
One of the biggest contributing factors to the hashrate increase was the delivery of ASICs and new projects coming online from the previous bull run that were started in 2022
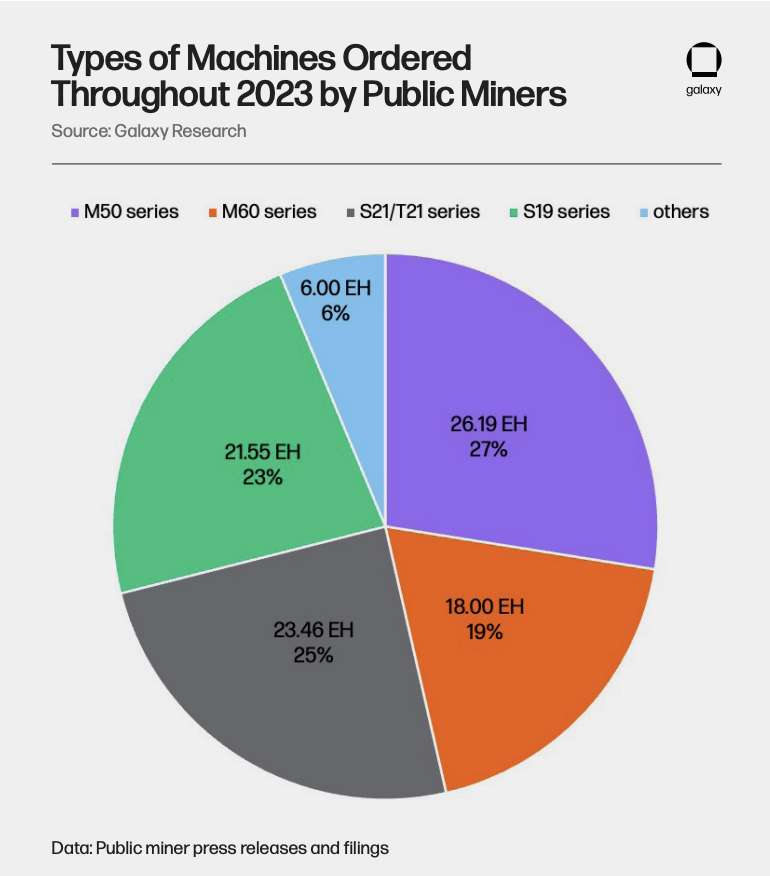
New generation of machines from Bitmain and MicroBT at relatively cheap prices such as the M50 series, M60 series, S19k Pro, S21, and T21
Natural gas prices subsiding in 2023, driving energy costs lower for miners
Bitcoin price propelling higher over the course of the year
Transaction fees periodically surging, providing miners with additional revenue
International hashrate coming online
ASIC manufacturers maintaining their production capacity at foundries and releasing new, more efficient models
Miners underclocking machines to improve breakevens
Equity capital markets opening up slowly over 2023, allowing public miners to raise capital for near term growth opportunities
Hashprice
The combination of movements in Bitcoin price, transaction fees, and network difficulty caused hashprice to fluctuate between $0.06 and $0.10 for much of 2023. Hashprice is a metric that refers to the expected value of 1 TH/s of hashing power per day and is a function of BTCUSD, difficulty, and miner revenue (block subsidy + fees). Hashprice did briefly drop below this range at the end of August and also went above this range in May, November, and December when transaction fees spiked.
Energy Prices
Natural gas is a crucial price setting component for the majority of power utilized by miners globally, especially in the U.S. where 30-35% of the implied global hashrate resides. Natural gas prices were remarkably stable throughout 2023. This stability stands in stark contrast to the volatility witnessed in 2022, where natural gas experienced significant fluctuations, partly attributed to disturbances in Eastern Europe, creating uncertainties in gas pipelines and global energy trade. This period prompted a global urgency to produce and store gas amidst the prevailing uncertainty.
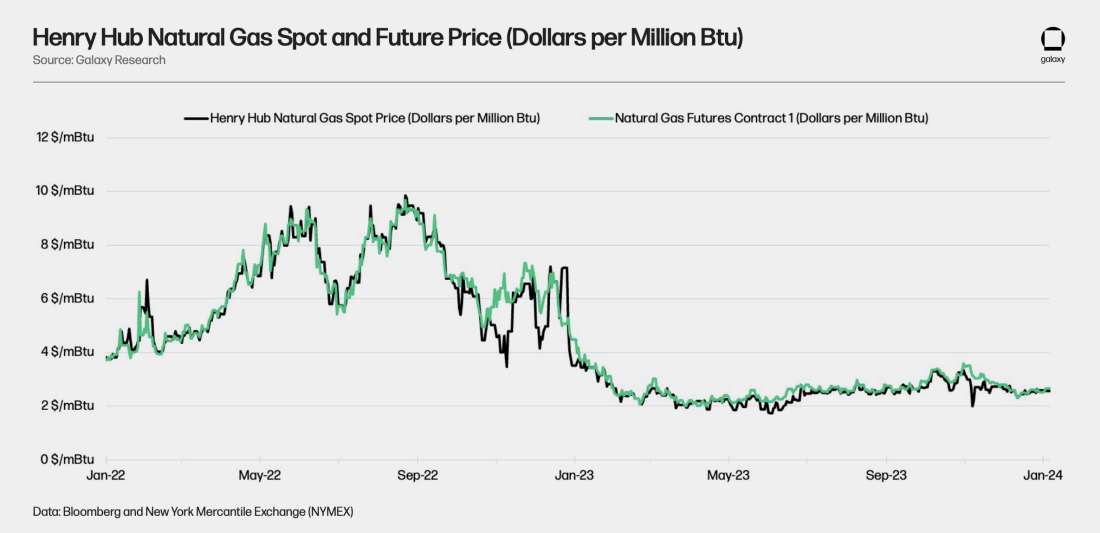
Several contributing factors have contributed to the relative stability in natural gas prices throughout 2023. In the United States, record-high natural gas production outpaced the growth in consumption, playing a pivotal role in maintaining stable prices. Simultaneously, an increase in natural gas inventories further contributed to this stability. The first half of 2023 witnessed mild temperatures across the United States, resulting in reduced demand for space heating, particularly in residential and commercial sectors. This consistent and flat pricing trajectory has bestowed miners with a more stable energy cost environment throughout 2023, offering a welcome margin relief and positioning them favorably as we approach the impending halving event.
Regulatory
2023 was marked by a few key pieces of legislation that had the potential to impact miners' ability to operate, particularly in ERCOT:
Texas Bill 1929, introduced in the first half of 2023, requires the registration of virtual currency mining facilities in the ERCOT power region that demand a large load of interruptible power, was put into effect on September 1, 2023.
Texas Bill 1751 proposed the prohibition of miners from participating in ancillary services and grid balancing programs but failed to go further than the Committee on State Affairs. This bill had a profound impact on the industry sentiment as it represented the first instance of an offensive bill against mining in the ERCOT region.
The DAME (Digital Asset Mining Energy) Tax was proposed by the Biden Administration and would impose a significant new tax on Bitcoin mining operations, though the tax was removed from the budget in a significant win for Bitcoin advocates.
New FASB rules to allow for the measurement of bitcoin at fair value on companies’ balance sheets. This rule change was discussed in our previous EOY report (2022) and will mostly benefit miners with large BTC treasuries by allowing them to account for their value at current prices, which will make their net income figures more attractive. This change is expected to go into effect in 2025 but earlier adoption will be allowed.
The extension of the Bank Secrecy Act (BSA) proposed by Senator Elizabeth Warren as part of the Digital Asset Money Laundering Act would extend the Know-Your-Customer (KYC) requirements to miners.
Other developments outside of the US suggest that countries are now competing to attract Bitcoin miners and provide regulatory clarity on mining.
Russia continues to expand its regulatory framework to treat Bitcoin as an exportable commodity. By equating Bitcoin mining with natural resource extraction, Russia is not only recognizing the significance of Bitcoin but also integrating it into their economic framework. This should continue to boost the country’s recent expansion into mining and is providing a “business friendly” alternative to countries with more restrictive policies.
Regulatory Trends in 2024
In the last year, the debate on Bitcoin environmental impact appears to have shifted towards cautious optimism and we expect this dynamic to continue in 2024, especially since the approval of spot Bitcoin ETFs will change how institutions approach the industry. Near-constant antagonism to Bitcoin mining in major media has given way to more nuanced conversations about electrical grid balancing, renewable energy incentivization, and waste consumption. Some notable, nuanced, and positive coverage and reports are listed below:
Bloomberg Intelligence – Bitcoin’s Energy Narrative Reverses as Sustainable Exceed 50%
Forbes – Why Bitcoin Mining Might Actually be Great for Sustainability
However, we believe that the status of mining pools in the US may be challenged as new mempool dynamics emerge (MEV) and new pool technologies are adopted.
More focus on the role of pools and miners in the transaction selection process.The latter half of 2023 saw the birth of two new pools (OCEAN and DEMAND) focused on decentralizing pooled mining by using StratumV2 and other technologies. The primary benefit of StratumV2 is that it allows for miners of a pool to participate in the block template construction process which has solely been determined by the pool operator. The democratization of block template construction is great for decentralizing mining, but the feature is opt-in for miners and due to certain regulatory risk from a KYC/AML standpoint it is unlikely that most miners will want to create their own block templates.
Insights and Trends from Public Miners
Treasury Management Strategy
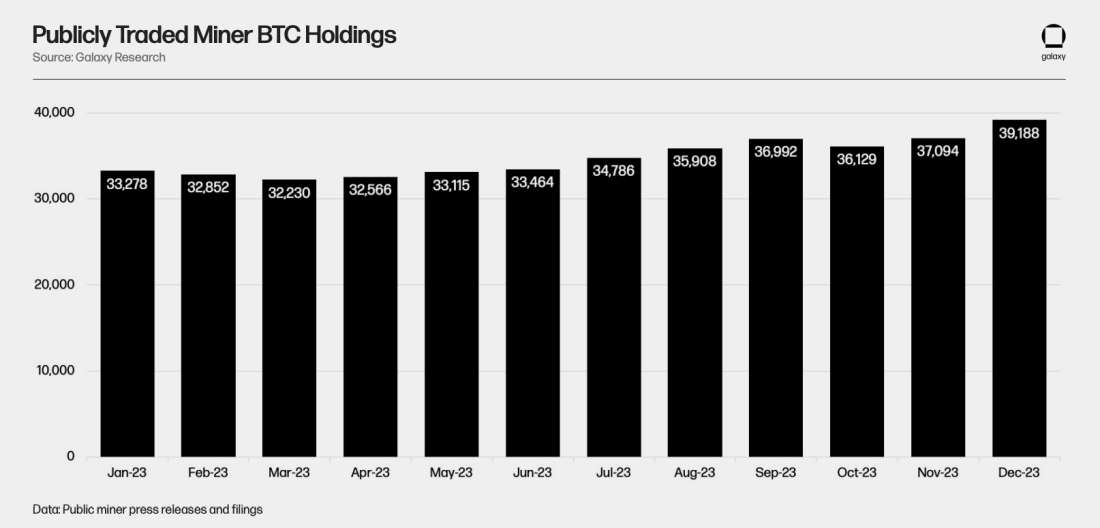
Despite earning more throughout 2023 due to BTC price appreciation and notable fee spikes, publicly traded miners mostly sold less BTC throughout the year.
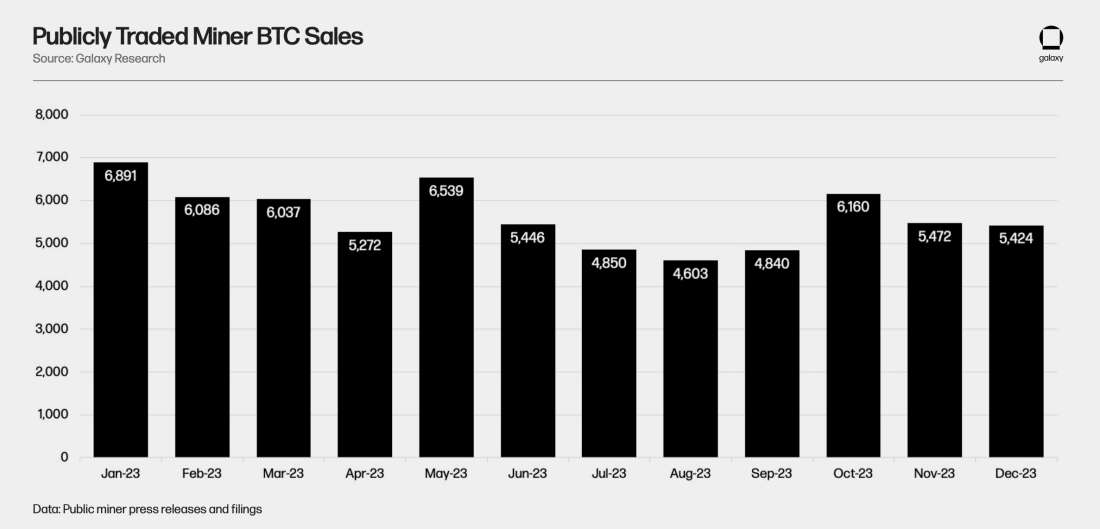
In 2022 and during the bull run of 2021, public miners largely adopted a HODL strategy with their production. As the market turned and bitcoin price declined, many of these public miners became forced sellers in order to deleverage their balance sheets and cover operating costs. Public miners’ treasury management strategies have since evolved towards more prudent methods by taking a balanced approach to holding bitcoin or selling all of it outright for cash. As mining economics improved during the second half of 2023, public miners became more comfortable holding more bitcoin and taking on price risk likely due to the ETF and halving narratives. Now that FASB has updated its guidance to allow for fair value accounting of bitcoin holdings on public company balance sheets, public miners may reembrace holding bitcoin on their balance sheet to an even greater extent.
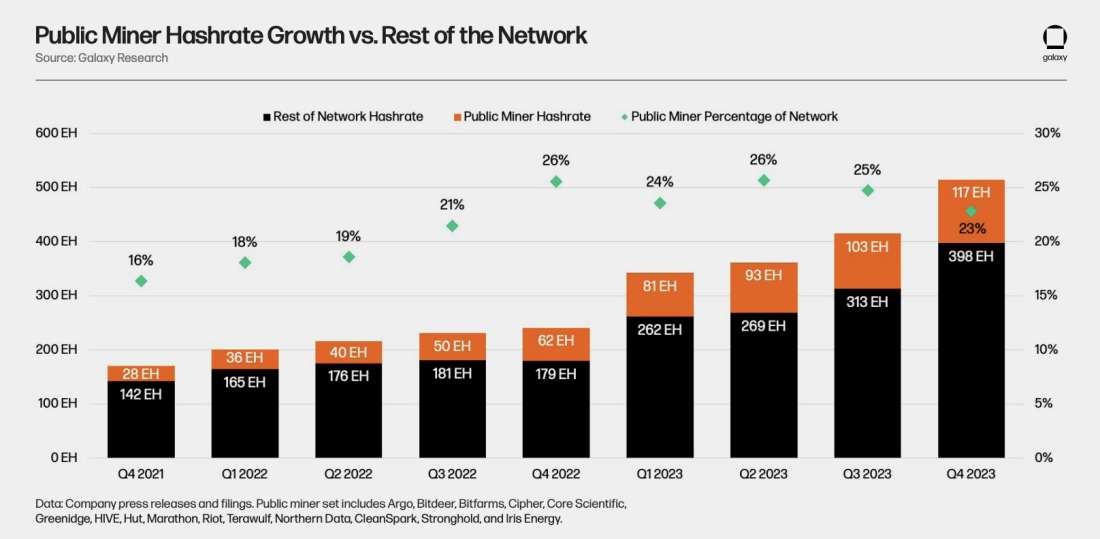
Public Miners Share of Network Hashrate
The crypto market’s destruction in 2022, coupled with rising interest rates, made it extremely difficult for publicly traded bitcoin miners to raise new equity capital or issue debt. As a result, equity and debt capital markets remained largely closed off during the first half of 2023, making it challenging for public miners to prioritize growth during much of 2023. This allowed miners in other geographies to cut into North American miners’ share of hashrate. In the second half of 2023, as mining economics improved, there was greater demand for mining exposure in the equity capital markets. North American miners' access to capital via the public markets gives them a tremendous advantage during growth cycles in mining versus private miners and miners in other geographies.
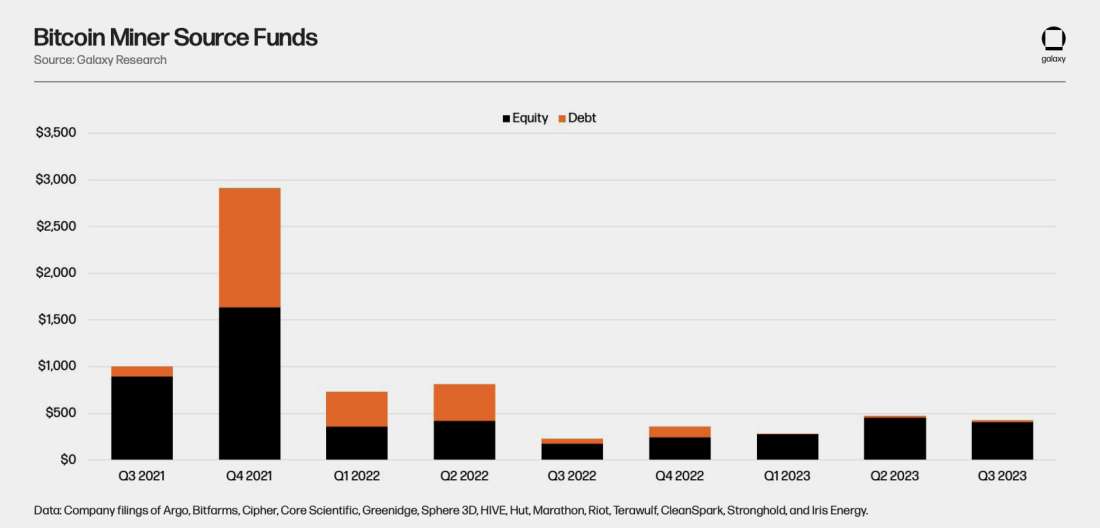
ASIC Investments
In the first half of 2023, most miners were still focused on energizing previous ASIC purchase orders made in 2022, while a select few miners made significant ASIC purchases. As equity capital markets improved in the second half of 2023, particularly in Q4, several miners announced large ASIC purchase orders. Notably, public miners raised a total of $1.1bn of equity capital over the first 3 quarters of 2023. That likely accelerated further in Q4 (public miner financials unreleased at the time of writing) as bitcoin price and sentiment improved as we got closer to the spot Bitcoin ETF approval. In comparison with equity capital, only $44M of debt capital was raised, highlighting the extreme challenge miners have had with relying on debt as a means to fund growth.
With the halving quickly approaching in early Q2, the primary focus for miners in 2024 has been improving fleet efficiency (reducing J/TH) with infrastructure and capacity expansion being more the secondary objective.
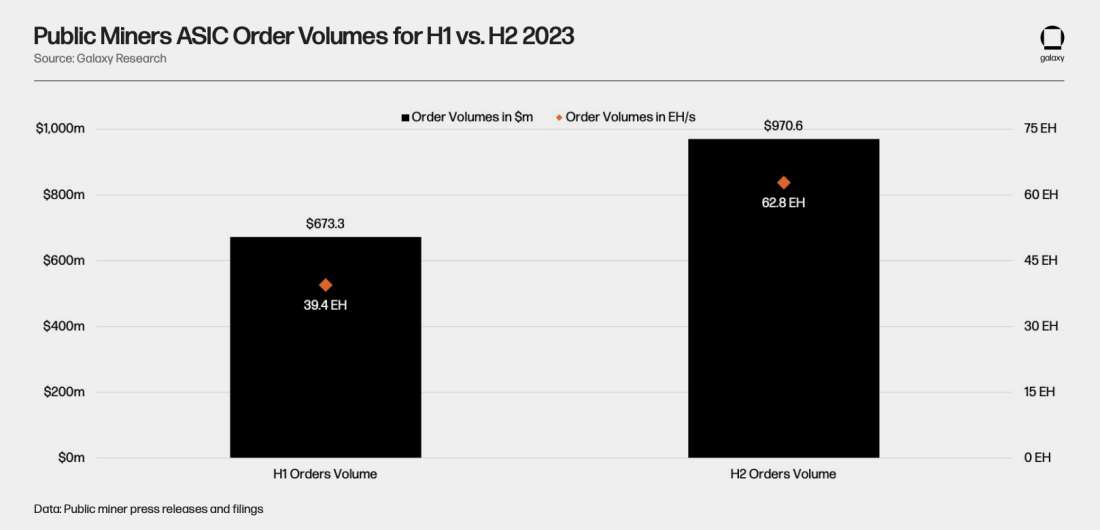
Over the course of the year, public miners purchased over 94 EH worth of machines valued at more than $1.53B.
In the second half of 2023, miners increased their purchase orders by 59.3% from 39.4 EH to 62.8 EH. Miners particularly focused on acquiring the new generation of machines with efficiencies under 20 J/TH like the S21/T21 & M66/M56 from Bitmain and MicroBT, respectively.
So far in 2024, miners have already purchased over $393M in machines with CleanSpark and Pheonix leading the pack.
Predictions for 2024
Transaction Fees and Blockspace Dynamics into the Halving
Transaction Fee Volatility Go Up
The market for blockspace fundamentally changed in 2023 due to Ordinals and other emerging token standards. As we have discussed at length into our Ordinal focused reports (Bitcoin Inscriptions & Ordinals: A $5bn Market and Bitcoin Inscriptions & Ordinals: A Maturing Ecosystem), this year has seen some incredible new developments on Bitcoin that have led to new sources of demand for Bitcoin blockspace. In turn, this demand has also introduced or exacerbated some mempool dynamics in a way that is not yet fully understood by all market participants.
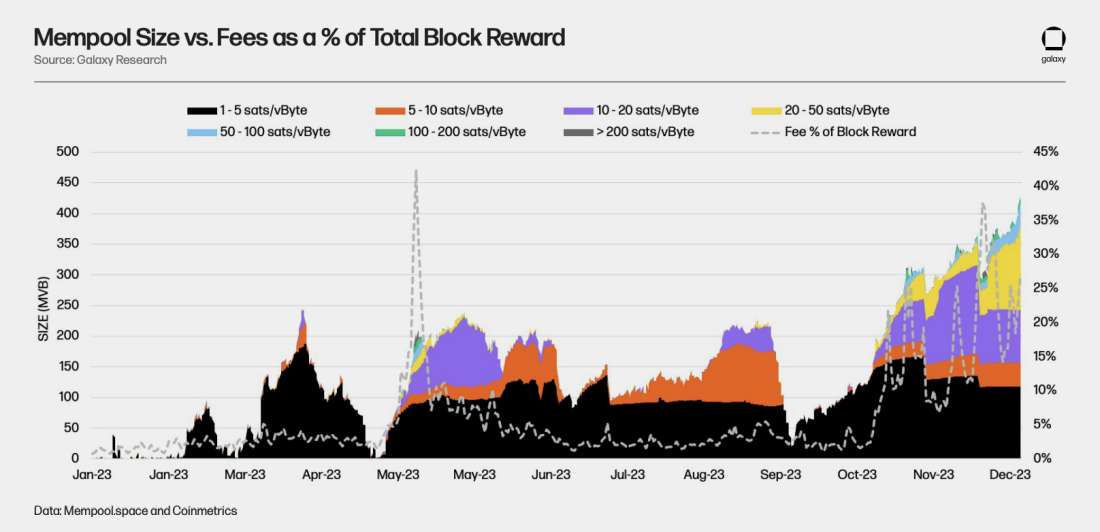
One direct consequence of this new activity has been increased transaction fee volatility and periods of mempool congestion that have demonstrated how little activity was needed on the blockchain to push fees to sustainable levels for Bitcoin miners (enough to cover the ever-decreasing issuance of BTC). Transaction fees as a percentage of overall block rewards is the metric generally used to compare fee levels across time. In 2023, the network experienced both an absolute increase in transaction fees and frequent spikes above 25% of rewards, which would correspond to about half of miner revenue after the halving.
Transaction fees resulting specifically from Ordinals and other metaprotocols will likely be the biggest “wildcard” for Bitcoin miners’ revenue in 2024, but this usage tends to be volatile. As it stands, most miners (and pools) are not accounting for a material portion their revenue to be dependent on volatile transaction fees. For example, while we might expect hashrate to drop following the halving, a significant fee spike around the same period could boost revenues sufficiently high, enabling less efficient miners that would otherwise be unprofitable to still mine at the margin. Furthermore, while most industry participants are focused on the impact of the halving on miners’ profitability, large changes in transaction fees over a given year could lead to significant hashprice volatility that would make it harder for miners to forecast their revenues.
To mitigate this, we suspect that further financialization of the mining industry will lead to the emergence of blockspace futures and transaction fee forwards, allowing miners to hedge out some transaction fee volatility. We could even see the emergence of a new class of opportunistic miners, coming online only when fee spikes occur, in a type of arbitrage opportunity similar to Texas miners taking advantage of power market fluctuations within ERCOT.
The emergence of Bitcoin as a settlement chain for new types of economic activity (NTFs, DeFi, Stablecoins) will consolidate demand for Bitcoin’s blockspace and lead to new mempool dynamics. If 2024 is anything like 2023, we’re likely to witness some narrative altering innovations on Bitcoin that bring new utility to Bitcoin and therefore drive more value to its native currency (BTC). Below is a list of potential innovations that could have such an effect on the Bitcoin protocol next year:
Taproot Assets: Taproot Assets (formerly known as TARO) will allow users to create NFTs and assets on-chain using Taproot Merkle Trees that will be interoperable off-chain directly through the Lightning Network. It is anticipated that the Stablecoins will be one of the major use cases for this new protocol, with the hope of directly competing with other chains to settle transactions at a low cost and instant finality. Taproot Assets has the potential to amplify the “token/DeFi on Bitcoin” narrative while bringing more transaction fees for miners.
Runes and new BRC token standards: “Runes” are being developed by Ordinals creator Casey Rodarmor as an alternative to BRC-20 by using the OP_RETURN field of Bitcoin transactions (this field is limited to 80 bytes by most routing nodes). While using this field is not new (it was even used by Tether to issue stablecoins on Bitcoin back in 2014), the new Runes protocol’s use of it could be more efficient for token issuance than the current reliance on JSON inside inscriptions. The CBRC token standard is also another contender when it comes to new coins. By being between 60% to 70% more efficient to mint and transfer, they hold a significant advantage over BRC-20 and have the potential to increase the economic density of blocks.
Covenants: The potential introduction of Covenants (TX_HASH proposal and “LNHANCE” proposal) to Bitcoin will lead to an increased usage of blockspace by users looking to take advantage of new functionalities such as VAULTS, Timeout Trees, and others.
DLCs and other types of smart contract execution layers: Discreet Log Contracts and innovative protocols like BitVM could lead to a major narrative for Bitcoin vs other chains as the protocol could become a new contender in the “Smart Contract” space. We have long believed the thesis that Bitcoin will become the ultimate “Settlement Chain” where most of the blockchain economic activity ends up and this kind of proposal would get us significantly closer to it.
New Layer 2 protocols: Scaling protocols such as Zero-Knowledge Rollups will also emerge as companies compete to bring rollups to Bitcoin. For example, Chainway's rollup is designed to publish L2 state proofs and represent a consolidated set of transactions using the ordinals protocol to publish proofs. Other scaling solutions likeArk (introduced in May 2023) could provide a “base load” for the mempool as Ark Service Providers (ASPs) continually settle L2 transactions on-chain on behalf of users. This source of new demand would only increase demand for blockspace but would also allow for the onboarding of millions more of users to the Bitcoin blockchain.
Another thing to consider in 2024 is the likely emergence of more complex forms of MEV on the Bitcoin blockchain. We’ve experienced two types of “MEV-like” events during 2023, with both having significant implications for market participants.
Sophon, the mint killer: The bot dubbed “Sophon”, created by Rijndael (CTO of Taproot Wizards) works by scanning the mempool for BRC-20 token mints and creating a duplicate transaction with a higher fee and a total supply for the token of 1 such that the deployer can claim the totality of the genesis token mint for himself. This bot caused the BRC-20 mint volumes to drop to near zero during the month of October as everyone saw their issuance transactions get replaced. Rijndael stopped running the bot himself because of the cost of running the attack, but the bot had a 75% success rate at frontrunning these mints. (This specific type of attack works specifically with BRC-20 mints due to their design and would not necessarily work against other token issuance protocols).
PSBT Front-running: Sniping of BRC/Ordinal transactions (transactions that are being spotted in the mempool before being mined and then replaced by the “attacker’s” own version of the transaction to make a profit) is a sort of MEV and miners could take advantage of such opportunities. While it appears that most of this new phenomenon is due to PSBT trades between individuals and not actually miners extracting values from unsuspecting users (rather, the highest paying transactions are just correctly mined first by pools), this could change in the future if the opportunity cost for miners becomes attractive enough (Fee Sniping could also become more common as the opportunity cost to replace a mined blocks becomes attractive).
New types of “MEV-like” behaviors could also emerge in 2024:
“Sat Hunting”: Because the value of Ordinals can be increased by inscribing images on specific sats, it is entirely possible that miners will start competing to mine the “rarest” sats in a not-so-distant future. With the halving coming up, we could even witness the first instance of a block reorganisation caused by miners fighting to get the first “Halving sat.” (On this point, the first block after the halving is also when Rodarmor’s “Runes” protocol launches, a launch which is likely to draw significant transaction fees and further increases the likelihood of reorganization).
Layer 2 related MEV: As Bitcoin developer Gregory Sanders pointed out recently, concerns about Ephemeral anchors with Lightning related transactions could lead to the emergence of some form of MEV where miners deliberately choose to mine one transaction without another tied to it in order to maximize their block reward.
Non-Standard Transactions: We can expect the share of “non-standard” transactions to increase as miners try to extract as much value per block as possible. These “non-standard” transactions are transactions that would not be usually relayed by nodes but can be sent directly to pools. For example, transactions over 100 kvB would not be relayed but in the case of large Inscriptions (Image or video), they can be sent directly to a pool to be mined in exchange for a fee paid Out-Of-Bands (not using the blockchain but by paying the pool directly). While this type of behavior causes centralization concerns, we expect it to grow as new forms of demand for blockspace emerge. Bitcoin developer 0xB10C estimates that over 20,000 non-standard transactions were mined since November 2021.
The Usage of RBF in a High-Fee Environment will Shape Mempool Activity
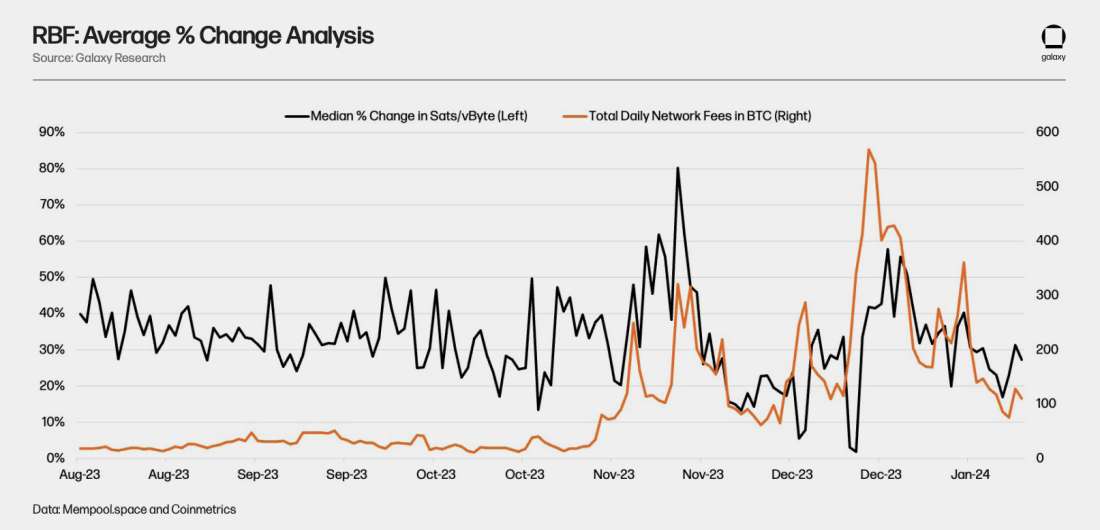
Fee bumping usage is becoming more common and useful for average users.RBF or “Replace-By-Fee” is one of the solutions that Bitcoin users can use to bump up their transactions when they become “stuck” in the mempool due to increasing fees. RBF allows users to increase the fee attached to their previously broadcast transaction, thereby growing the incentive for miners to include it in a block. With other solutions like Child Pays for Parent (CPFP), RBF is useful during fee spikes as it allows users to have their transaction confirmed faster by the network if the need arises. As we’ve explained previously, 2023 was a volatile year for transaction fees, and as a result, it was harder for users to know and set the “right” feerate for their transactions, leading to a significant increase in RBF usage.
In turn, increased RBF usage leads to higher feerates in the mempool and higher revenues for miners. The typical replacement feerate ranges between 20% to 50% higher than the original transaction’s feerate, increasing the incentive for miners to include these transactions in a block.
While technical users will generally use RBF to increase their feerates, other solutions have emerged to help the average user. Known as “Transaction Accelerators”, these services are being advertised by pools like Binance and data aggregators like Mempool.Space. Accelerators allow users to pay the pool directly (off-chain with fiat currency or BTC) to include their transaction in the next block. These Out-Of-Band (OOB) transactions are not reflected in the total rewards of a block but can contribute to a significant increase in revenues for miners.
Because the optimal feerate for a transaction is becoming less predictable as competition for blockspace increases, we can expect OOB transactions to make up a larger percentage of pools’/miners’ revenues as the financialization of blockspace continues.
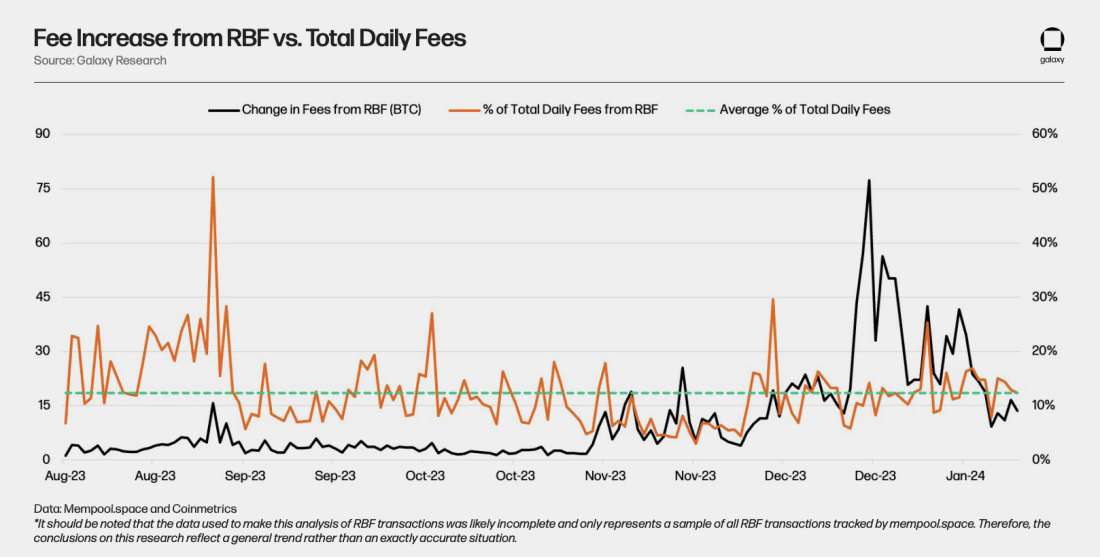
The share of fees from RBF transactions will increase in 2024 as transaction fees continue to rise. A surprising finding of this analysis of RBF replacements is the amount of fees generated from this type of transaction:
The share of transactions fees generated by RBF replacements hovers between 10% and 20% under normal mempool conditions, with a spike during low-fee periods reaching a peak of 50% in September 2023.
With the halving coming up and transaction fees doubling as a share of block rewards, RBF transactions will become more relevant for miners therefore providing a greater incentive for miners to run a Full RBF node in order to see those transactions in the mempool and include them in their block template. According to research by Bitcoin developer Peter Todd, 31% of hashrate, over at least 4 different pools, is mining full-RBF as of August 2023 (could be upwards of 70% as of January 2024). The introduction of the “One-Shot Replace-By-Fee” proposal by Peter Todd will also be a leading factor in providing miners with additional incentives to run full-RBF nodes. Indeed, this new RBF policy would work by “allowing the replacement to only happen when it [the feerate] would immediately bring a transaction close enough to the top of the mempool to be mined in the next block or so” which would increase the competition between high-time preference users of the blockchain. In a sense, this new form of RBF could provide a constant level of demand for the next block which dictates overall transaction fees for miners.
Going forward, we expect mempool-focused proposals such as Cluster Mempools, Package Relay, V3 transaction relay and Ephemeral Anchors to make more tools and policies available for users to target the optimal feerate for their needs and avoid overpaying for transactions while also benefiting miners by allowing them to build more efficient block templates.
Exploring the Relationship Between Blocktimes and Feerates
Historical data shows a strong relationship between block times and feerates. Given the potential for unprofitable miners to come offline around the halving and blocktimes to increase, in the analysis below, we quantify the impact that increasing blocktimes could have on exacerbating fee pressures.
With the exception of 2009 and 2021, average annual blocktimes were faster than the 10 min interval between blocks set by the Bitcoin network. Just over the past 3 years (since Jan. 1, 2021), blocktimes averaged 9 min 51 sec, corresponding to a meteoric 262% rise in mining difficulty over the same time period, leading us to believe that this phenomenon would have had a significant impact on miners’ revenues by naturally reducing feerates at the mempool level. While the concept is easy to understand and logical in nature (more frequent blocks = less time for fee pressure to build up), we found that its consequences are often disregarded.
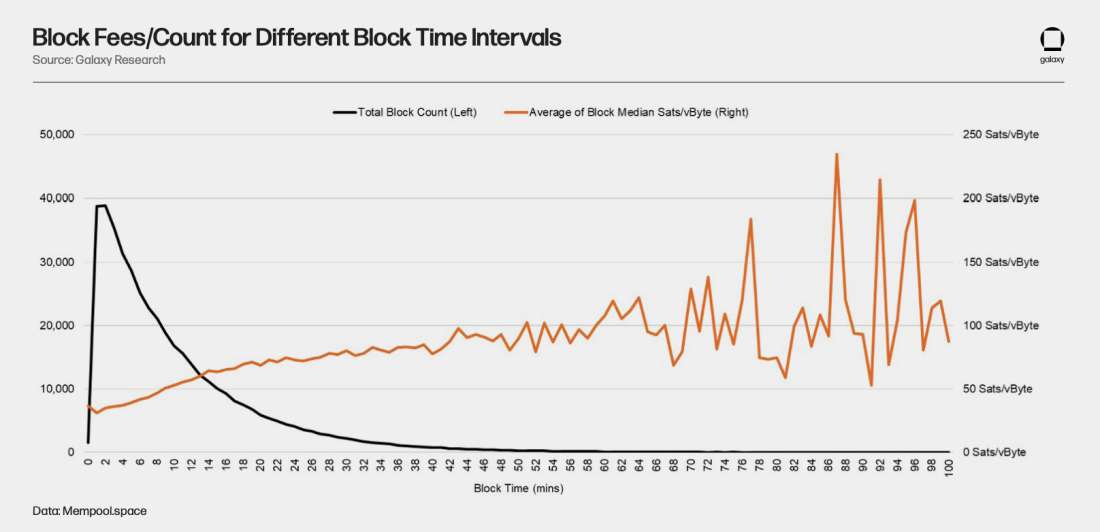
First to do this, we ran a correlation analysis between Blocktimes and Average of Median Transaction Sats/vByte per Block for blocks 390,000 (mined in December 2015) to 825,460 (mined in January 2024) to identify if the relationship was confirmed by on-chain data. In general, Median Sats/vByte (feerates) steadily increased in tandem with blocktimes, with the relationship becoming less obvious as blocktimes ticked further away from 10 minutes. The chart below shows the total number and the Median Transaction Sats/vByte per Block for blocks mined within different one minute intervals from 0 mins to 100 mins.
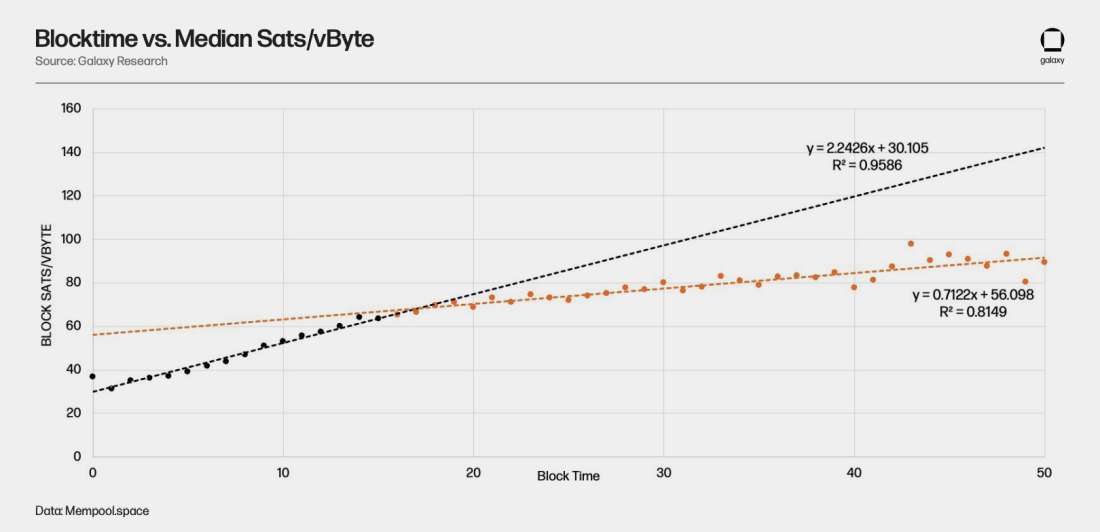
Furthermore, by running a regression analysis between blocktimes and Median Transaction Sats/vByte per Block, we can quantify the relationship between these two variables. The analysis below indicates that, on average, for every minute that a block comes in faster than the 15 mins, feerates decrease by around 2.2 Sat/vByte per minute (or about 4% of the roughly 54 Sats/vByte median block fee for blocks mined around 10 minutes). However, for each minute above 15 mins, feerates increase by 0.71 Sat/vByte per minute (or about 1% of the roughly 54 Sats/vByte median block fee for blocks mined around 10 minutes). We distinguish trendlines for blocktimes below and above 15 mins because there is a noticeable change in slope at around this blocktime. After the 15 min mark, increases in blocktimes have a diminishing impact on feerates. A reasonable explanation of this phenomenon is that after 15 mins, block templates are likely nearing their finalized form, and barring any major mempool changes (i.e. from an ordinals collection being inscribed), it becomes increasingly unlikely for other transactions to displace those currently anticipated to be in the block.
A corollary to these findings is that feerates have been naturally lowered by the expanding network hashrate over the past few years and will continue to be in 2024 with the possible exception of the period following the halving where a decline in hashrate could add feerate pressure.
While hashrate itself may not serve as the primary catalyst for the overarching feerates, it undoubtedly has the potential to amplify existing trends in feerate dynamics. For example, the recent surge in fees was predominantly fueled by a surge in demand for blockspace rather than corresponding shifts in hashrate. Nevertheless, had blocktimes been slower in 2023, it could have intensified these spikes, resulting in prolonged intervals between blocks and consequently allowing fees to accumulate at a more pronounced rate.
Next, we use the above to understand what the impact of this relationship between block times and transaction fees on miners’ revenues could be as transactions fees become even more relevant after the halving. By expanding the results of this analysis to overall mining revenues, we can begin to explore how feerates will be impacted both by the Halving and the continued race between miners to increase their mining capacity. One example of how miner activity impacts block times and feerates is when the network experiences a sudden rise in feerates when most miners in ERCOT simultaneously curtail their operations due to high power prices.
To illustrate this, if we expect around 20% of network hashrate to come offline during the halving, blocktimes would on average increase by 20% before being adjusted. This is because of a mechanism called the “difficulty adjustment”, where mining difficulty (the average expected time to find a block) is adjusted every two weeks (2016 blocks) in order to keep blocktime around 10 minutes.
Using the relationship we previously derived for blocktimes less than 15 mins, this leads to a corresponding increase in average feerates of 8% (12 min blocktimes, implying 2 mins above 10 min target times 4% per min increase - all else being equal). To put this in perspective, if we apply this to a volatile fee period, such as epoch 407 (between blocks 820,512 and 822,528, +6.98% upward adjustment), an 8% increase in fees over this difficulty epoch would represent an additional 355.7 bitcoin ($15M at $42,000 bitcoin price) in fee revenues for miners.
On the other hand, if the average blocktime in 2024 is around 9.5 minutes (average blocktime in 2023 was 9.74 minutes), we could expect the theoretical negative impact on miners’ revenue to be about 2% of transaction fees. (This analysis is solely focusing on the fee impact of hashrate and not the increased revenue associated with a decrease in difficulty following the halving).
*However, one could say that because miners mine more blocks than the network anticipated over a given year, the additional revenue from receiving more block subsidy would more than largely compensate for the lost income of suppressed feerates. In reality, both ways of looking at the situation are valid and depend on your time preference (ie. Miners are generating more revenues over a given year, but they accelerate the coming of another halving by mining blocks faster).
To conclude, the confluence of heightened inscription activity, escalated usage of Replace-By-Fee (RBF), and a deceleration in block times may collectively harmonize, giving rise to an unprecedented surge in fee pressures and volatility coinciding with the occurrence of the halving event in April.
Risk Management Strategies
Power Hedging
The expected volatility of hashprice around the upcoming halving in April 2024 has added an additional layer of complexity to miner energy strategies. Miners, dispersed across diverse geographical regions, power operations in a multitude of ways including standard grid connection, renewables colocation, wasted gas generation, and many more. Miners with exposure to variable grid pricing around the world will need to take a prudent approach to their energy management strategies.
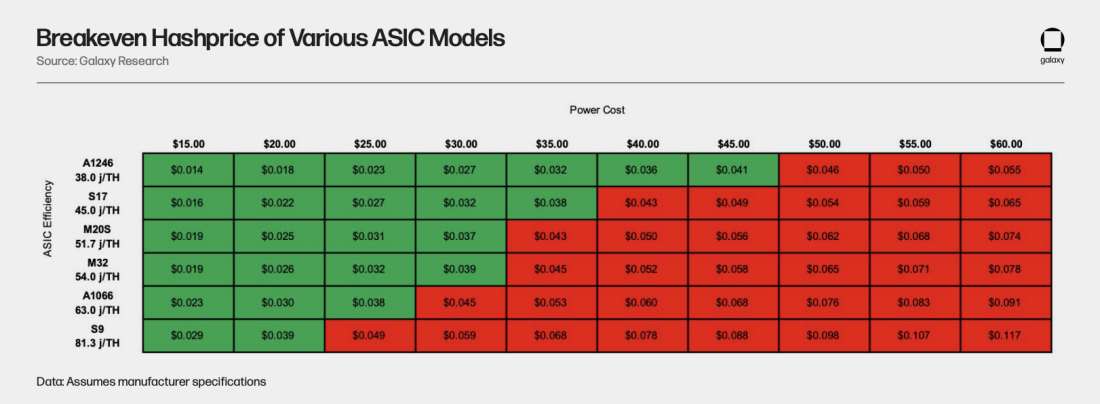
The table below shows the breakeven revenue in dollars per MWh generated at different fleet efficiency and hashprice combinations. Power costs above this breakeven threshold would cause ASICs to run unprofitably. At the time of writing, hashprice is $0.082 ($43k BTC price, 10% fees, 520 EH), and all else equal, would drop to $0.045 post halving. At this hashprice level, a miner that has a 30 J/TH fleet efficiency would need energy prices to be below $63/MWh in order to have a positive gross profit.
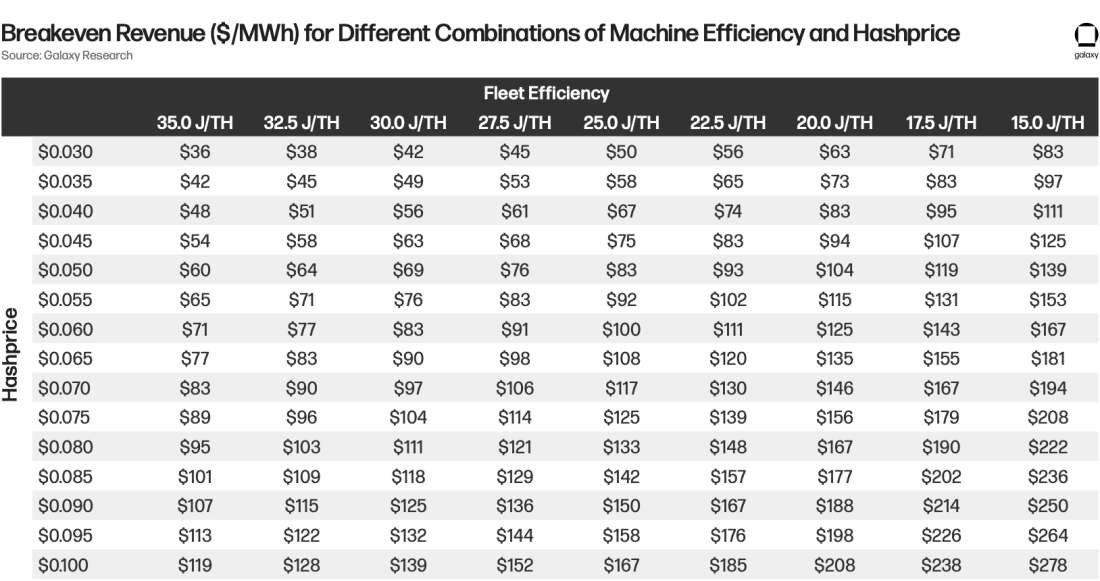
Several miners with grid interconnection are confronted with the task of delineating the proportion of their overall capacity that they want to hedge. Miners that opt for more index exposure expose themselves to the risk of energy prices settling higher than the marginal breakeven of their fleet for prolonged periods of time, causing increased downtime and fewer bitcoin mined. Miners that hedge their energy prices can withstand energy price volatility and gain upside exposure, but risk locking in a fixed hedge price that exceeds their marginal breakeven and where spot power prices settle.
As an example, around the clock hedges for load zone West in ERCOT for May – Aug 2024 (the few months following the April 2024 halving) have peaked at around $80/MWh. At this level, hashprice would have to settle at greater than $0.07 for miners with a machine efficiency of at most 35 J/TH to remain profitable. If hashprice falls below this threshold and real time energy prices also settle below $80/MWh, a miner would neither be able to mine profitably, nor be able liquidate their hedge in the money. Miners may be more comfortable hedging only a portion of their fleet and taking on more index exposure to reduce the risk of these hedge obligations forcing them into unprofitable scenarios, while also retaining the ability to capitalize on upside power price swings if they do occur. With increasing their index exposure allocations, although downtime may increase, miners would have more flexibility over their operating periods, rather than being forced to operate (or liquidate hedges) to cut losses if the marginal breakeven settles below the fixed strike of the hedge.
This analysis also shows the need to prioritize machine efficiency. While older generation fleets with machine efficiency of 35 J/TH become unprofitable if hashprice falls below $0.07 in the scenario above, miners with a fleet comprised of S21s would need hashprice to fall below $0.04 to be unprofitable with a hedged power cost of $80/MWh. In the hosting context, miners with newer generation machines would still be able to withstand higher fixed fee contracts post-halving.
We can also observe the magnitude of how the improvement in efficiency impacts gross margins. In the table below, we adjust the previous table to assume a fixed energy price of $80/MWh and calculate gross margins at different hashprice levels for machine fleets with different efficiencies.
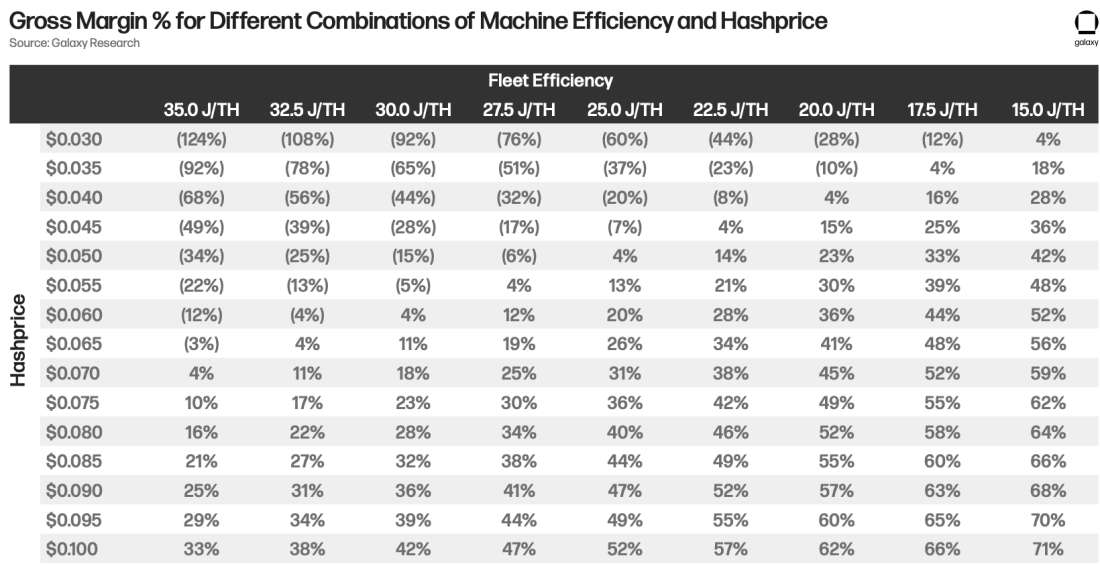
The table above shows that at a hashprice of $0.07, fleets with efficiency of 35 J/TH generate a meager 4% gross margin, whereas fleets with efficiency of 17.5 J/TH are still at a robust 52%.
In conclusion, the decision for miners to enter different forward hedges becomes convoluted post-halving and is heavily dependent on fleet efficiency. Miners risk entering into a hedge where the fixed price they take surpasses both the marginal breakeven of their machines and spot electricity prices, causing them either to mine unprofitably or liquidate the hedge at out of the money prices.
Production Hedging
Bitcoin mining draws intriguing parallels with traditional commodity production businesses, such as the practices observed in the oil and gas industry. In some cases, the similarities are striking. However, a notable disparity arises in the realm of risk management, a facet that may witness increased attention from public miners, potentially leading to greater disclosure.
The year 2023 unfolded as a volatile period for miners, particularly in the context of block rewards. As we wrote above, this volatility can be attributed to spikes in transaction fees resulting from innovative bidding strategies and the utilization of block space. As the much-anticipated halving event approaches, miners find themselves increasingly dependent on transaction fees to sustain their top line, aiming to offset the impending reduction in block subsidies. This heightened reliance and the accompanying uncertainty are propelling miners to explore hedging strategies, serving as a pivotal element in more robust risk management practices. This move not only seeks to reassure investors but also suggests a strategic shift towards leveraging various derivatives tailored to their risk profiles and speculative inclinations.
The strategic advantages of adopting hedging strategies in 2024 are multifaceted, as eloquently outlined in a comprehensive report from GSR.
Predictability: As miners' revenues are intricately tied to hashprice, miners have a greater range of options when devising their risk management strategies. Hedging BTC price, the primary element in the equation (hashprice), is often more straightforward and liquid. This is due to its ease of underwriting by desks, offering a degree of predictability in revenue for miners with respect to price they produce BTC at. This enhanced predictability contributes to a more certain top line. However, with the continuous growth in network hashrate and the accompanying rise in difficulty, coin production declines. To foster predictability in this dynamic environment, miners can utilize hedging products such as hashrate orientated derivatives, to secure a portion of their revenue. This segues into the second aspect – miners who hedge coin production through hashrate derivatives can establish a more stable 'cost to mine.' This assumption holds provided that all other contributing factors to the cost to mine remain constant, including power, OPEX, and uptime. Miners who choose to hedge both their power costs and production gain the highest degree of control over their cost to mine. This strategy allows them to lock in more predictable and stable cost ranges. Such an approach proves particularly advantageous during periods of increased ambiguity and uncertainty in other facets influencing production. Instances such as blackouts, machine malfunctions, or fluctuations in pool luck, and alterations in pool payout structures leading to a decrease in expected BTC mined can be effectively navigated with a robust hedging strategy covering both power and production.
Access to Capital & Shareholder Value: In the current market landscape, asserting that public mining stocks trade purely on fundamentals is challenging. Market rewards for miners often manifest through increased capital liquidity, facilitating growth, infrastructure investment, and addressing other financial obligations. Public miners facing revenue volatility due to the variable nature of BTC prices need to demonstrate stability to shareholders. This stability can be effectively achieved and communicated to the market through prudent hedging strategies, which is likely to enhance how shareholders may value of a miner’s public equity. With more stable cash flows, clear visibility into the ability to cover existing debt, and the capacity to finance expansion, miners embracing hedging provide investors with an opportunity to invest in stability within the dynamic realm of Bitcoin mining—a valuable asset in today's market.
Production Alpha: With the increasing significance of transaction fee revenue for miners, a potential alpha opportunity arises through the strategic utilization of hashrate derivatives. In periods when transaction fees are at peak levels, miners can lock in production at those rates, allowing them to maintain high production levels even if transaction fee rates recede. Given the ongoing volatility in transaction fee spikes, a trend that shows no signs of diminishing, miners can capitalize on this variability. On the flip side, miners can engage in hashrate swaps when anticipating short-term transaction fee spikes, providing them with a versatile approach to the use of derivatives.
While there are several positive aspects associated with using such derivative products, they also pose a multitude of challenging problems, potentially contributing to the scarcity of sell-side offerings and a simultaneous lack in buy-side activity. The complexity of these contracts, especially the distinction between cash-settled and physically settled variants, introduces intricate challenges. Physically settled contracts, in particular, carry the burden of significant counterparty risks, involving not only the hashrate operator (miners) but also their chosen pool, and other factors that contribute to uptime.
The market reflects these complexities, evident in the shallow liquidity for such structured products, underscoring the inefficiency in their pricing. As we step into 2024, a new year brings a fresh horizon of miner revenue volatility, shaped by the halving and an upswing in ordinal and inception activities. The evolving landscape prompts a revaluation of the intricate dynamics surrounding these derivative contracts.
Hashrate derivatives aside, miners have a plethora of options to hedge and integrate various risk management products into their strategy. This includes options, costless collars, and forwards. These straightforward structures are highly liquid and boast quick execution times.
Bitcoin Miner Strategy Divergence
In 2023, significant divergence emerged among Bitcoin miner business models, propelled by the onset of a low hashprice period in 2022 and compounded by uncertainties surrounding the impending 2024 halving event. Industry-wide introspection into cost structures ensued, prompting miners to identify ways to improve margins. With electricity costs constituting a substantial portion of total cash expenditures, miners refined energy strategies and moved closer to the source through vertical integration to avoid additional hosting fees. Amidst this paradigm shift, miners with hosting business lines found themselves compelled to recalibrate contract economics to better align with mining cash flows. And finally, as capital dwindled in the mining industry, several miners ventured into the realm of High-Performance Computing (HPC) in a bid to tap into other sources of capital, particularly as valuations in the AI sector surged. Below, we delve into the viability and implications of these different business models in 2024 as the halving approaches and with the spot Bitcoin ETFs having been approved.
Vertical Integration
In 2024, we expect hashprice volatility to increase, caused by fluctuating fee/mempool dynamics, approval of the spot Bitcoin ETFs and its impact on price, and the potential for sharp moves in difficulty following the halving. In an effort to better shield themselves from this hashprice volatility, we expect miners to push for further vertical integration to position themselves lower on the cost curve by removing additional costs from hosting intermediaries. Hosted proprietary mining operations can certainly help miners generate cash flow on machines if they lack infrastructure, and miners that choose to pursue this route will have to focus on plugging in new generation machines and finding hosting partners with conducive terms.
Most of the efforts to vertically integrate so far have come from miners owning their own sites, electrical infrastructure, and machines. However, miners have also started to diversify how they are vertically integrating to improve efficiency at different parts of the construction, hardware, software, and energy generation stacks. Some examples so far include Riot’s purchase of ESS Metron, which has given them better control of electrical supply chains, Marathon’s stake in ASIC manufacturer Auradine, which could drive down future ASIC procurement costs, Marathon’s operation of their own pool (which eliminates pool fees), and Hut8’s recent stalking horse bid victory, giving them control of energy generation.
The path of least resistance is movement closer to the energy source, where we expect further integration between generation and mining because of the clear synergies that exist between the two. This can be manifested in several ways including colocation with renewable generation or construction of operations powered by wasted energy sources. However, as miners consider future expansion opportunities, we expect more partnerships to form between miners and ASIC manufacturers, as there are also natural synergies between the two. Miners can reduce their capex burden and ASIC manufacturers can gain a better sense of future production requirements to avoid periods of sustaining superfluous inventory.
We expect vertical integration to continue in 2024 as miners compete to differentiate themselves and bring in capital for future growth.
Hosting Business
The hosting landscape will change in 2024. Hosting providers will likely prioritize engaging with clients that are able to plug in newer generation machines that have higher breakeven dollar per MWh thresholds to ensure that clients can stay online as much as possible.
Contracts, particularly those with miners with older fleets, will also have to be structured in a way that aligns the cash flow generation of the miners. This means that hosting contracts will shift away from fixed price contracts to cash flow splits, especially for clients that seek to plug in older generation machines. Cash flow splits allow the hosting provider to benefit from the upside of hashprice and miners to stay profitable if hashprice falls. Energy curtailment splits may also become prevalent, offering both the miner and hosting provider upside exposure to energy prices and driving down the blended cost to mine a bitcoin.
Hosting still provides miners with a way to grow in a capital efficient manner by filling interim capacity that is available with third party machines to monetize as much power available as possible. Those that can manage their energy prices effectively are able to generate a relatively stable cash flow stream that can help with infrastructure underwriting.
High Performance Computing (HPC)
Several miners announced expansion plans into the HPC datacenter space in 2023 because of the low hashprice environment, lack of capital available to fund mining growth, and the AI boom. These companies aimed to diversify revenue streams heading into the halving and access different sources of capital. The general scarcity of large power generation in primary and secondary markets in the US has provided further tailwinds for miners to transition to HPC.
The transition from bitcoin mining to HPC is a convoluted undertaking and the business models are fundamentally different. From a construction and design perspective, HPC datacenters have more complex, parallelized networking structures finely tuned to optimize data throughput for faster runtime. They also adhere to more stringent redundancy and cooling requirements to ensure that there is minimal inadvertent downtime. While uptime requirements are dependent on the client and can be relaxed in certain instances, it is imperative that HPC datacenters also have appropriate caching mechanisms in place to facilitate the seamless resumption of operations from the point of interruption when systems are restored online, which is not the case with bitcoin mining datacenters. As a byproduct of these more nuanced build specifications, capital requirements for HPC datacenter construction are orders of magnitude larger than bitcoin mining datacenters.
From an operations and finance perspective, the businesses also have their differences. HPC businesses either can either co-locate with another Cloud Service Provider (CSP) or create their own Cloud platform. The former is much simpler, and the datacenter operator would enter into a lease type agreement with the CSP and focus primarily on site management with little end-user interaction. Cash flows in this lease structure are generally stable and recurring in nature with higher margin that mining hosting businesses. In the latter, the firm would have to build out more expansive software, sales, and billings teams to grow their client base and bolster the user experience. Unlike in the lease scenario, offering cloud services likely means that the datacenter operator has also invested in GPUs that the cloud platform interacts with. This adds significant additional capital needed. As the CSP, however, these businesses would likely be able to charge substantially more to the end client instead of having an intermediate CSP that interfaces with the end client.
There are also external variables out of the control of the company that pose risks to the energization of operations. The soaring demand for new generation GPUs and related infrastructure has caused a medium-term supply shortage, making it difficult for firms to receive their equipment on predictable timetables.
Cash flow generated may be higher and less volatile than bitcoin mining and while HPC expansion announcements have accelerated valuations for certain companies, paramount to the success of this business segment is the ability to execute on the construction, design, operations, and finance aspects of the business while also navigating around the previously mentioned external risks. The companies that had ventured into this segment in 2023 were still in the early stages of growth, and 2024 will be the true test of viability.
The foray into HPC in a bear market helped miners locate new sources of capital in 2023. However, there is an inherent opportunity cost of allocating power to bitcoin mining versus to HPC workloads. With spot Bitcoin ETFs approved and capital anticipated to return to the industry, companies will likely pivot back to growing mining operations. Companies that expanded too quickly in HPC may see reduced correlations to bitcoin price in the longer term and capped upside as investors value the business more as traditional datacenters than bitcoin proxies.
Impact of the Bitcoin ETF on Public Miners
With the approval of Bitcoin ETF products, investors can now access direct exposure to bitcoin price. Prior to the approval of the ETF, public mining stocks were one of the only traditional vehicles through which investors could get exposure to bitcoin price appreciation. In the short-term, the approval of the ETF is likely to be a consideration for investors in evaluating whether to invest in public mining stocks. Retail investors are likely to continue to view and trade miners as a leveraged long bitcoin trade with the ETFs as the primary benchmark for performance. On the other hand, institutions are seemingly more likely in the short run to go long the Bitcoin ETFs and short mining stocks, which we’ve seen start to play out since the beginning of 2024.
In the longer term, a Bitcoin ETF should pose competition for public miners. As more savvy investors enter the market, bitcoin miners will have to demonstrate through earnings why they would be a better investment over spot bitcoin. Miners’ beta to bitcoin and trading multiples should be determined by the individual company’s ability to generate strong free cash flow. This could pose capital raising challenges in the equity market for lower margin, higher cost operators with weaker track records for return on capital. Miners stock price should also react much more negatively to dilution as a means of funding growth unless the miner is able to demonstrate strong prospects for return on capital as investors can just buy the ETF and not have to worry about dilution. However, bitcoin miners could benefit from the inclusion in a broader array of ETFs and fund products as well as research and coverage where those benefits outweigh some of the cons of increased competition from the Bitcoin ETFs.
Mergers and Acquisitions
In retrospect of our Mid-year report, where we discussed effective strategies for miners preparing for the impending halving in 2024, M&A emerged as a key strategic move. In 2024, miners may consider M&A for a variety of strategic reasons including reducing their high-power costs, satisfying a lack of a compelling growth narrative, becoming more vertically integrated, or raising capital.
As we previously wrote, miners faced capital-raising difficulties, especially when BTC was trading between $18k-$25k. Investor caution prevailed as miners utilized cash and BTC reserves to cover working capital needs, with uncertainty surrounding future revenue growth amid climbing difficulty levels and sideways BTC price action. Today, the situation has markedly changed with improving mining economics driven by a rise in hashprice due to BTC performance and increasing transaction fees. Low natural gas prices have further contributed to manageable energy costs, positioning gross mining margins significantly better than the earlier part of 2023.
However, despite these positive developments, the fourth halving poses a potential challenge. While fleet upgrades and joint ventures have been instrumental in enhancing operational resilience, miners unprepared for the halving may find themselves in a precarious position. Some reasons for an uptick in 2024 M&A activity are listed below:
Attractive Small Caps: Public miners with smaller market capitalizations may become appealing targets for better capitalized and more liquid miners, particularly those with lower debt levels.
Aiming Vertical: Private miners, especially those that are more vertically integrated, may become targets for acquisition or merger with synergistic players who can lower their cost to mine and take more control of their own destiny. For example, some less vertically aligned miners have not have the ability to curtail operations when their power exceeds their breakeven price.
Value Trade: Private miners with low valuations, that are undergoing restructuring, or that are seeking a route to survival could be attractive purchases. Acquirers may view these as value trades, anticipating future gains when market conditions improve.
Real Option: Mining operations demonstrate instant cashflow positivity, assuming low energy costs and minimized operational expenditures at current hashprice levels, presenting an enticing entry point for a robust IRR. This proposition becomes even more appealing when the site acquisition cost falls within an acceptable range, particularly when managed by operators with prior experience in running mining facilities. Additionally, sites located in deregulated markets could be viewed more valuable by bidders, as these facilities serve as a proxy for monetizing power that might otherwise face curtailment. The strategic positioning of mining operations in such markets enhances their value proposition, aligning with the broader trend of industry players seeking to optimize operational efficiency.
Over the past year, miners faced capital constraints and poor liquidity. The strategy of raising funds through ATM equity offerings, albeit at steep discounts and shareholder dilution, primarily aimed at upgrading ASIC fleets, has left miners with an increased sense of urgency to finding suitable locations to accommodate the influx of hashrate.
With existing sites at full capacity and limited visibility on additional capacity coming online, the opportunity arises to explore acquisitions of sites or entities capable of accommodating on-order fleets. Identifying such opportunities may prove challenging, as many energization timelines extend into 2025/26, and back orders for electrical infrastructure have lengthy lead times.
However, 2024 is poised to be a pivotal year for turnkey sites which are ready to be filled with this new hashrate. Miners, now trading considerably better than compared to the beginning of 2023, are eager for acquisitions to meet their growing liquidity and capacity needs.
Hashrate Forecast
Estimating network hashrate during the year of a halving event is an exceedingly difficult task due to the sensitivity of various assumptions that have a significant impact on the economic viability of mining. With that being said, we used a top-down approach, leveraging a series of scenario modelling to try and provide what we feel is a reasonable range of expectations for end of year network hashrate. We present one method of projecting hashrate. There are other approaches to take such as bottom-up methods that may yield somewhat different conclusions. Based on our analysis, we expect end-of-year 2024 network hashrate to end in a range between 675 EH and 725 EH.
Methodology
In our initial analysis, we wanted to understand how much hashrate the network could bear given various bitcoin price levels and various levels of implied hashprice post halving assuming transaction fees are at 20% of block rewards.
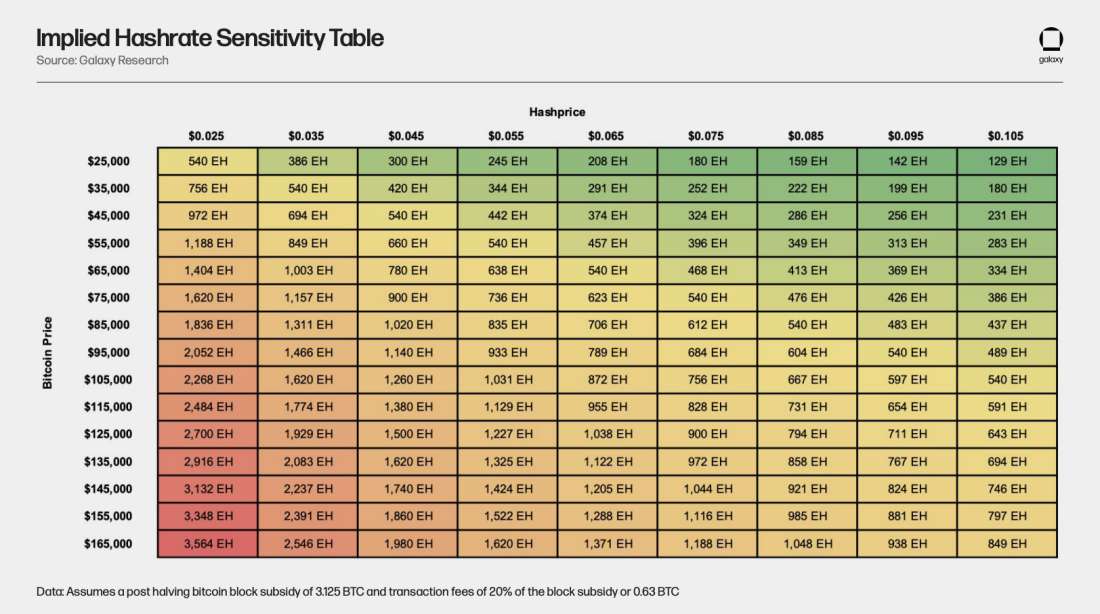
Using the table above, we can see what implied hashrate is at various levels of hashprice and BTC price. We estimated that $0.035 could be the new hashprice breakeven floor for the network post halving with increased energization of new generation machines. To arrive at this estimate, we analyzed the breakeven hashprice of various ASIC models at various power costs. We used a hashprice breakeven floor of $0.035 as an educated guess for the hashprice low of the next cycle which represents a 36% decrease from the hashprice low of the current cycle. Furthermore, $0.035 represents the average breakeven hashprice of new generation machines at a $75 per MWh power cost.
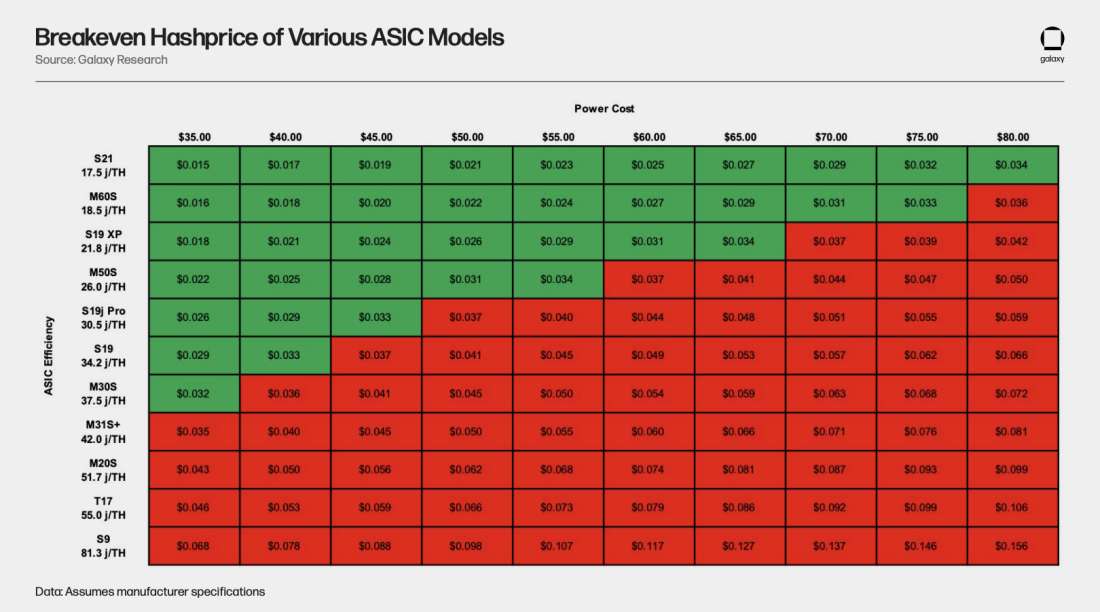
As illustrated by this analysis, the newest generation of machines such as the S21, T21, or M60S series are able to mine profitability at very low hashprices even if miners have relatively high-power costs. This suggests that there is substantial room for hashrate to increase post halving even if bitcoin price does not materially improve. Additionally, miners will still be able to operate S19j Pros profitably, if they have access to cheap power or if they underclock their machines. With S19j Pros currently making up the large majority of network we may not observe a significant percentage of these machines come offline post halving.
Based on these two studies, if bitcoin price ranges between $45,000 and $55,000 for 2024, network hashrate could reach as high as 694 EH – 849 EH assuming a hashprice floor of $0.035. The ASICs that would likely make up the majority of the network in order to operate profitably under these conditions would be the S21, T21, M60S, S19 XP, and M50 series machines. However, the primary constraint will be the supply chain and production volumes for these new generation of machines as well as access to capital to be able to acquire them. It is likely that we won’t see the new generation of machines surpass the S19 and M30 series of machines until 2025 based on current delivery schedules.
Next, we wanted to put into context some of the constraints on hashrate growth such as infrastructure availability. To do this, we quantified how much hashrate the network could bare if we assumed that all existing machines were currently replaced with newer generation machines. In the left-hand column of the table, we sensitized current network efficiency to calculate the implied amount of power capacity currently supporting the network assuming 500 EH of network hashrate.
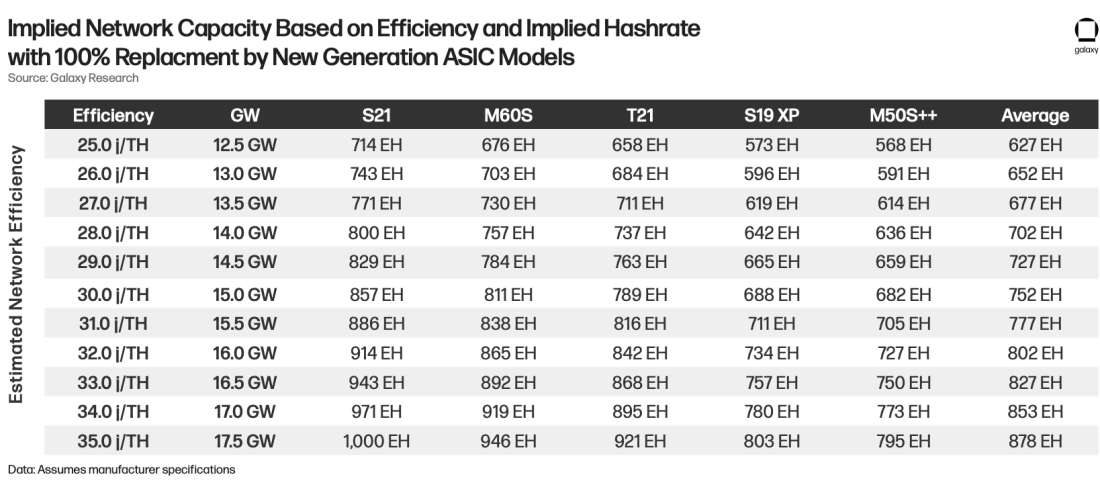
If we assume that the existing average network efficiency is 30 J/TH, which equates to 15 GW of power capacity, network hashrate could reach a theoretical ceiling of as much as 757 EH if you assume every existing ASIC in the network was replaced with an even distribution of the ASIC models presented in the analysis. 30 J/TH is a reasonable baseline assumption as it is equivalent to the machine efficiency of the S19j Pro.
Next, we sensitized the net increase in hashrate from replacing existing machines in the network with newer generation machines assuming that the average machine in the network had an efficiency of 30 J/TH. The previous sensitivity table reflected a theoretical ceiling based on the assumption that all machines in the network were replaced with new generation machines. However, in reality, we know that is highly unlikely to happen due to supply chain and capital constraints as well as miners being able to operate older generation machines profitably by underclock or having low power costs.
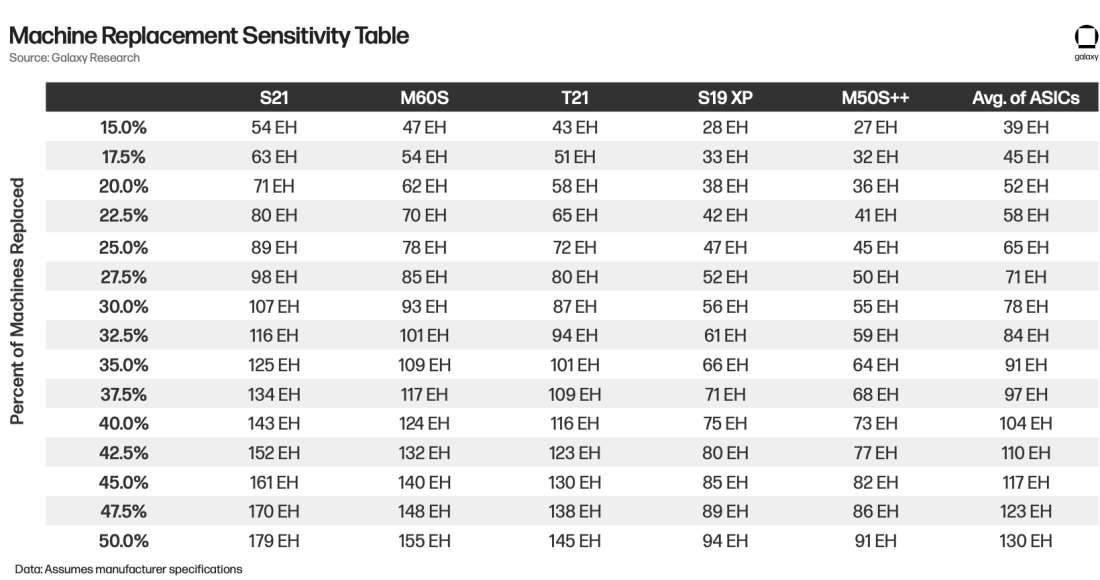
The table suggests for example that if we assume 25% of machines are replaced with M60S machines there would be a net 78 EH increase in network hashrate.
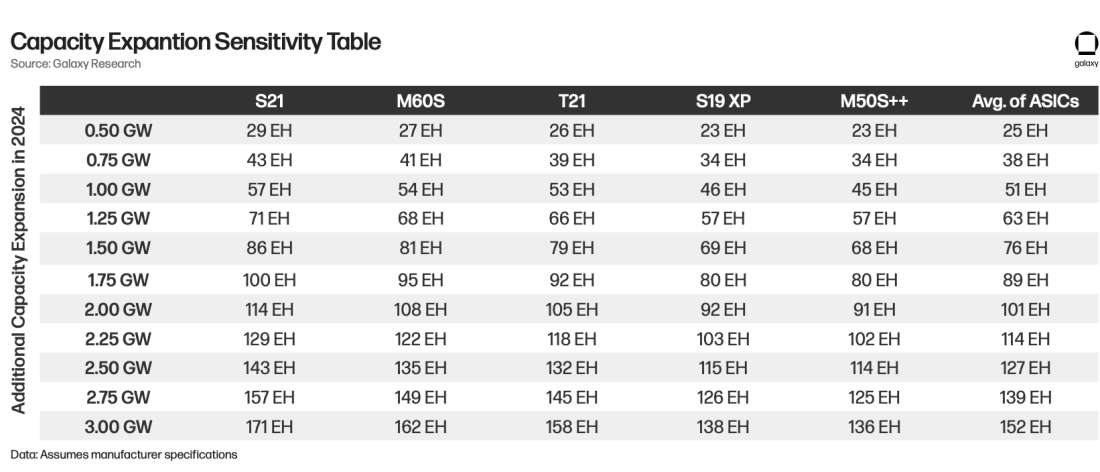
Next, we created a sensitivity table for additional infrastructure capacity that might be energized in 2024 assuming that this new capacity would be energized with various new generation ASIC models. If we assume the average efficiency of a machine that was energized in 2023 was 30 J/TH, then that would imply 8 GW of new capacity for the year. However, much the growth and expansion capacity delivered in 2023 is attributable to the investment cycle of 2021.
To bring all the analysis together, we combined the results of the Machine Replacement Sensitivity Table and the Capacity Expansion Sensitivity Table to create the table below, which shows a range of total potential hashrate for year-end 2024. It works by taking the end of year network hashrate of 500 EH and adding the amount of hashrate that would be added to the network coming from various amounts of capacity expansion and percent of existing machines being replaced in the network assuming an even distribution of S21, T21, M60S, S19 XP, and M50S++ machines.
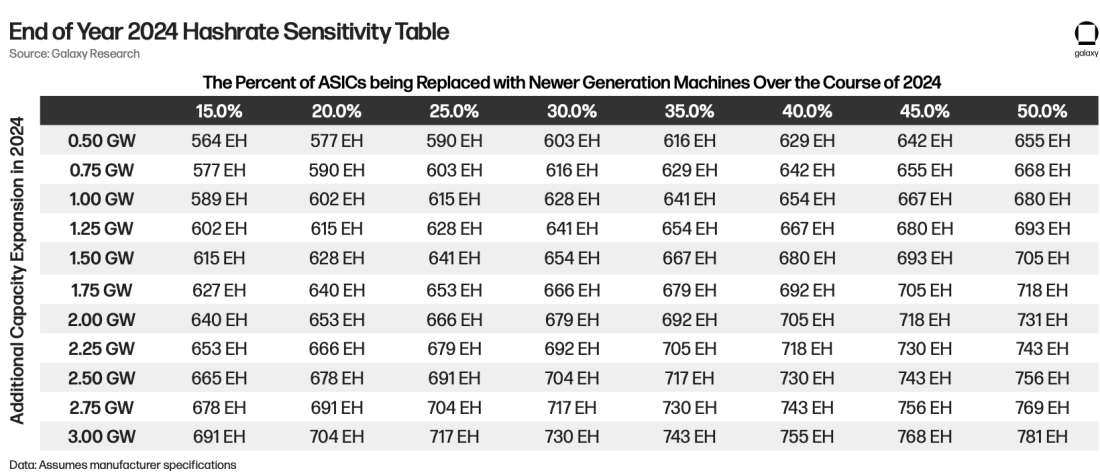
Due to public miner’s announcements around infrastructure expansion and ASIC purchases we think it’s reasonable that an additional 2 – 3 GW of infrastructure capacity will be energized in 2024 and that between 25 –35% of existing ASICs will be replaced over the course of 2024 with new generation machines. Given our analysis, we estimate a potential year-end hashrate range for 2024 of 675 EH to 725 EH, which equates to a 35 – 45% increase in network hashrate for the year.
How Much Hashrate May Come Offline at the Halving
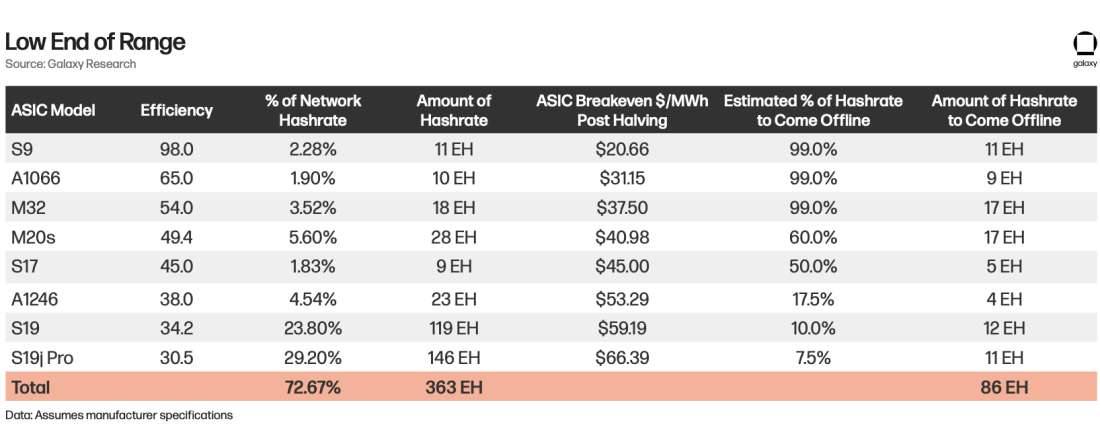
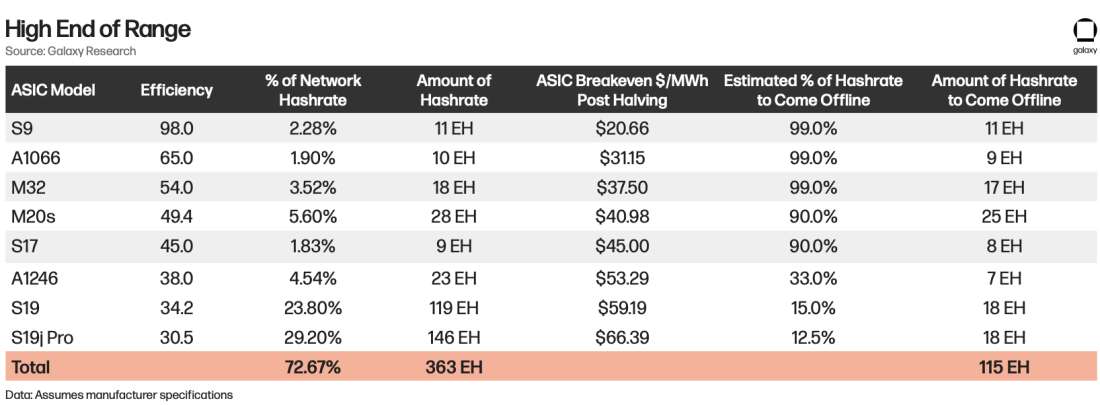
According to data from Coinmetrics, roughly 19.7% of network hashrate at the conclusion of 2023 is made up of M20S, M32, S17, A1066, A1246, and S9 machines. With year end network hashrate at roughly 515 EH, the implied contribution to network hashrate coming from this group of machines is 98 EH. To come up with an estimate for the percentage of machines that could come offline we calculated the breakeven $/MWh of popular ASIC models in the network based on estimated post halving economics including a block subsidy of 3.125 and transaction fees making up 15% of rewards and a bitcoin price of $45,000. We then analyzed a combination of forward-looking power prices and implied power costs from public miners to inform our percentage of estimated hashrate to come offline by ASIC model.
Given how sensitive the breakevens are for the various ASIC models to bitcoin price and transaction fees as a percent of rewards we estimate that between 15 – 20% of network hashrate coming from the ASIC models presented below could come offline, which represents between 86 – 115 EH.
It is likely that miners operating these older and more inefficient machines are running custom firmware to improve the efficiency of the ASICs and thus improve their breakeven threshold. Furthermore, it is probable that instead of certain ASIC models fully exiting the network they will just change hands to miners with cheaper power costs. For miners that can no longer run S19s profitably and need to upgrade, miners who are currently running S17s or less efficient machines may upgrade their machines with S19s or S19j Pros.
Conclusion
2023 was a year of growth and recovery for the mining industry. Over the course of the year, miners enjoyed higher bitcoin prices, increased transaction fees, and lower energy costs, resulting in a meaningfully higher hashprice and margins even in the face of network hashrate doubling for the year. Looking ahead to the halving, miners are taking advantage of improved liquidity and demand in the equity capital markets to fund new infrastructure expansion and ASIC purchases to improve fleet efficiency. As we get closer to the halving, we expect to see hashrate continue to rise driven largely by installations of new generation machines such as the T21, S21, and M60 series. Mergers and acquisitions of private miners and developed infrastructure is likely to see an uptick in activity as we get closer to the halving as well as miners continue to position themselves and adapt for post halving economics. Lastly, we see transaction fee volatility as being the biggest wildcard for the mining industry post halving as it will be significant driver of hashprice, difficulty, and block time variance as well as have broader implications for pool payout schemes and miner curtailment signals.
Glossary
Network Hashprice - Network hashprice, often simply referred to as hashprice, is a measure of dollar-denominated daily expected revenue from mining with a single terahash per second of hashrate on a daily basis given current conditions around bitcoin price, block rewards and network hashrate.
Sats per TH - Is a measure of bitcoin-denominated daily expected revenue from mining with a single terahash per second of hashrate on a daily basis given current conditions around block rewards and network hashrate. 1 satoshi represents one one-hundred millionth of a bitcoin.
Operational Breakeven Cost - Operational breakeven cost attempts to quantify all recurring expenditures that require a true cash outlay and includes cost of revenues, selling, general, and administrative (SG&A) expenses, and interest expenses, while excluding all non-cash expenses such as employee stock-based compensation and depreciation and amortization.
Network Hashrate - The network hashrate is the cumulative processing power of mining machines securing the network.
Ordinal – A serialization methodology for individual satoshis following “Ordinal Theory”
Inscription – An inscription is the arbitrary data stored in the witness field of a transaction.
Block Subsidy - The block subsidy is the amount of new bitcoin minted in each block. The block subsidy halves every 210,000 blocks (roughly every 4 years) according to Bitcoin’s issuance schedule and is currently 6.25 BTC.
Transaction Fees - Blocks can contain many transactions with fees attached to incentivize their confirmation and prevent spam. In addition to the block subsidy, miners also receive the transaction fees for all of the transactions included in the block that they mine.
Block Reward -The block reward is the combination of the block subsidy and all transaction fees paid by transactions in a specific block.
Hashrate - Hashrate is a measure of the computational power per second used when mining.
Power Draw - Power draw is a measure of the amount of electricity consumed to operate an ASIC or mining machine per hour.
Mining Pool - A mining pool is a middleman that aggregates multiple miners’ hashpower. Mining pools aggregate pool members’ hashes, submit successful proofs of work to the network, and distribute rewards to contributing miners proportionately to the amount of work performed. Mining on a pool reduces payout variance for miners, who would otherwise have to deal with significant risk from finding blocks at unpredictable intervals.
Terahash - A terahash (TH) is one trillion hashes, which is equivalent to making one trillion guesses at solving the puzzle to add the next block to bitcoin’s blockchain. The hashrate of most mining rigs is measured in terahashes per second (TH/s).
Exahash - A exahash (EH) is one quintillion hashes, which is equivalent to making one quintillion guesses at solving the puzzle to add the next block to bitcoin’s blockchain. The total network hashrate is typically measured in exahashes per second (EH/s), as is that of some large mining operations.
Legal Disclosure:
This document, and the information contained herein, has been provided to you by Galaxy Digital Holdings LP and its affiliates (“Galaxy Digital”) solely for informational purposes. This document may not be reproduced or redistributed in whole or in part, in any format, without the express written approval of Galaxy Digital. Neither the information, nor any opinion contained in this document, constitutes an offer to buy or sell, or a solicitation of an offer to buy or sell, any advisory services, securities, futures, options or other financial instruments or to participate in any advisory services or trading strategy. Nothing contained in this document constitutes investment, legal or tax advice or is an endorsement of any of the stablecoins mentioned herein. You should make your own investigations and evaluations of the information herein. Any decisions based on information contained in this document are the sole responsibility of the reader. Certain statements in this document reflect Galaxy Digital’s views, estimates, opinions or predictions (which may be based on proprietary models and assumptions, including, in particular, Galaxy Digital’s views on the current and future market for certain digital assets), and there is no guarantee that these views, estimates, opinions or predictions are currently accurate or that they will be ultimately realized. To the extent these assumptions or models are not correct or circumstances change, the actual performance may vary substantially from, and be less than, the estimates included herein. None of Galaxy Digital nor any of its affiliates, shareholders, partners, members, directors, officers, management, employees or representatives makes any representation or warranty, express or implied, as to the accuracy or completeness of any of the information or any other information (whether communicated in written or oral form) transmitted or made available to you. Each of the aforementioned parties expressly disclaims any and all liability relating to or resulting from the use of this information. Certain information contained herein (including financial information) has been obtained from published and non-published sources. Such information has not been independently verified by Galaxy Digital and, Galaxy Digital, does not assume responsibility for the accuracy of such information. Affiliates of Galaxy Digital may have owned, hedged and sold or may own, hedge and sell investments in some of the digital assets and protocols discussed in this document. Except where otherwise indicated, the information in this document is based on matters as they exist as of the date of preparation and not as of any future date, and will not be updated or otherwise revised to reflect information that subsequently becomes available, or circumstances existing or changes occurring after the date hereof. This document provides links to other Websites that we think might be of interest to you. Please note that when you click on one of these links, you may be moving to a provider’s website that is not associated with Galaxy Digital. These linked sites and their providers are not controlled by us, and we are not responsible for the contents or the proper operation of any linked site. The inclusion of any link does not imply our endorsement or our adoption of the statements therein. We encourage you to read the terms of use and privacy statements of these linked sites as their policies may differ from ours. The foregoing does not constitute a “research report” as defined by FINRA Rule 2241 or a “debt research report” as defined by FINRA Rule 2242 and was not prepared by Galaxy Digital Partners LLC. For all inquiries, please email [email protected]. ©Copyright Galaxy Digital Holdings LP 2024. All rights reserved.