


10 Charts that Show RWA, DeFi, and Ethereum Ecosystems are Vibrant
Executive Summary
Now more than 50 days into 2024, we have seen all-time highs made in the market cap of tokenized RWAs on-chain, two-year highs set in the number of addresses participating in DeFi across some of the major L1s and L2s, and Ethereum’s ecosystem of L2s remains persistently vibrant. This report highlights some of the key trends unfolding around the industry through the lens of on-chain data.
Key Takeaways
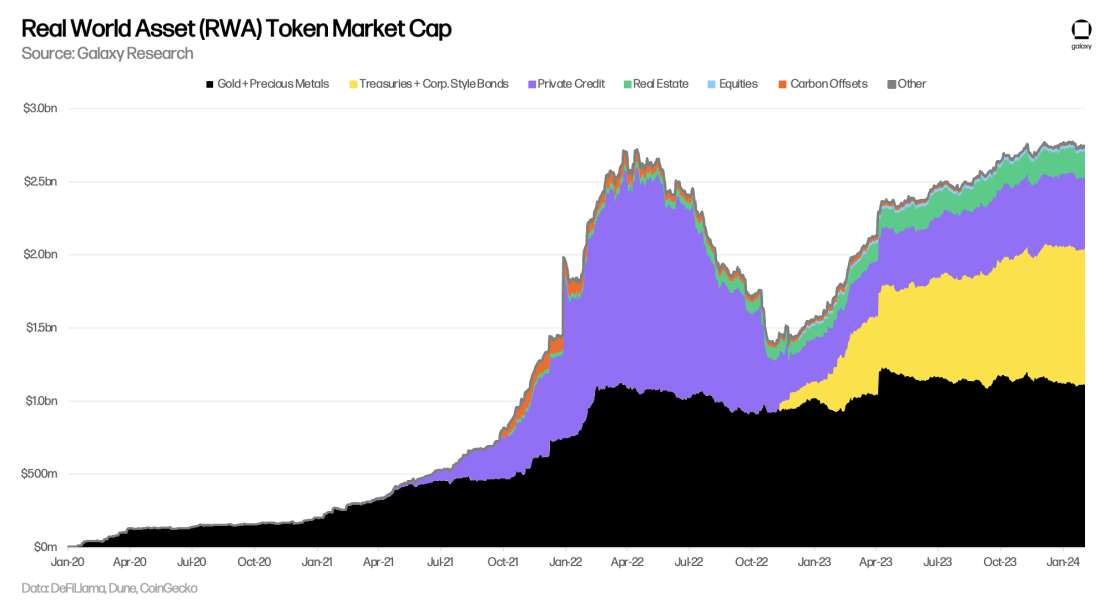
The total RWA token market cap made all-time highs around $2.774bn on February 2 and the market of tokenized financial assets (i.e. treasuries and bonds, private credit, and real estate) made new highs of $1.614bn on February 8. In spite of the RWA token market cap reaching this milestone, crypto-native assets are gaining market share against RWAs in key areas of DeFi.
The number of addresses interacting with DeFi across major L1s and L2s is near two-year highs at 445k addresses. Dexes have been one of the most common types of DeFi applications that users interact with when using DeFi for the first time.
In the Ethereum ecosystem (L1 and major L2s), the number of daily active addresses have reached all-time highs and daily transaction counts continue to push higher. L2 revenues have also seen substantial growth over the last month.
RWAs
The market cap of tokenized real-world assets reached new all-time highs at $2.774bn on February 2, 2024. Notably, financial assets, including treasuries and other bonds, private credit, and real estate, made new all-time highs at $1.614bn on February 8, 2024. Note, these values only account for the value of RWA tokens themselves, like Ondo’s OUSG and Tether’s XAUT, on public blockchains and do not include stablecoins or issuer tokens, such as ONDO and CFG. T-Bill/ bond dominance of financial asset RWAs is 58.1% and is down about 110 basis points off its all-time high as of February 26, 2024.
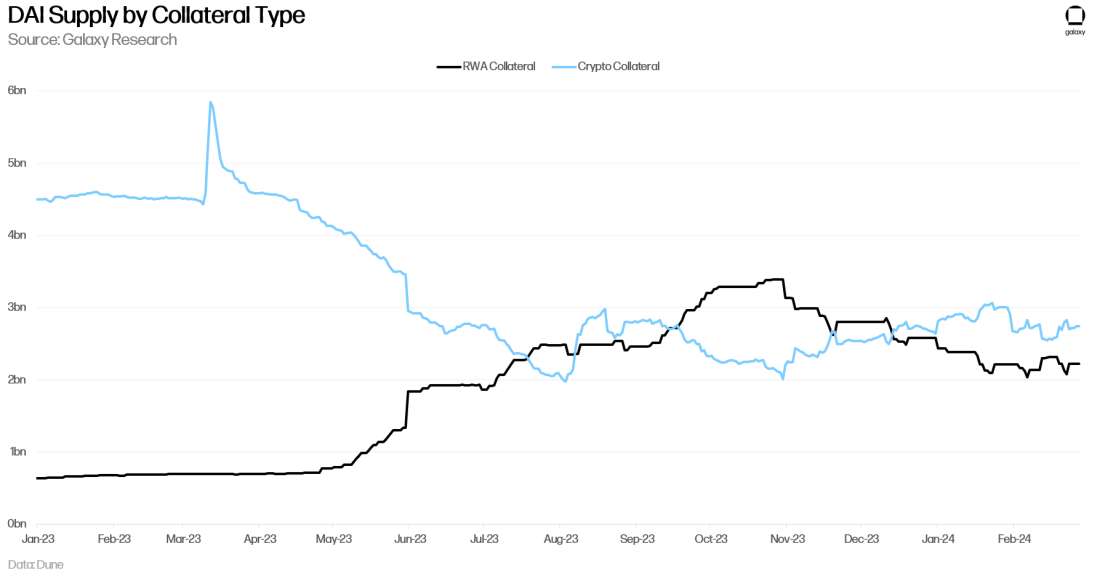
Despite the market cap of RWA tokens making new highs on-chain, the dominance and use of RWAs in on-chain products has been receding. This is most obvious in the collateralization of DAI, where the use of RWAs has been steadily declining since late October 2023. This is a key sign highlighting that there is growing preference for the use of crypto-native assets over RWAs on-chain, and in turn demand for crypto generally. Recent growth in LST-backed stablecoins only adds to this notion, and suggests the trend is strong.
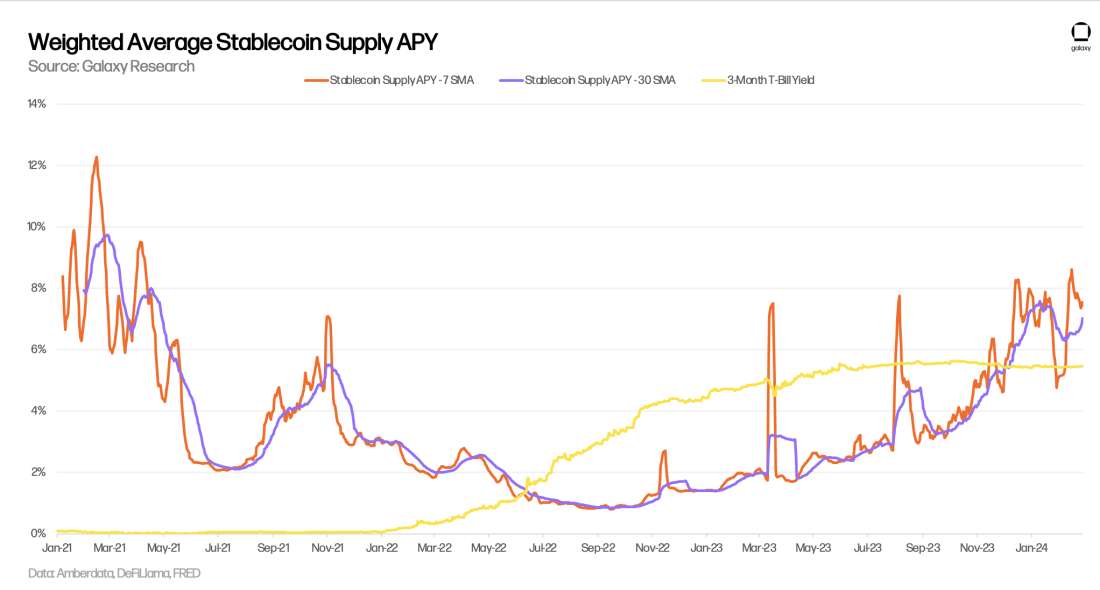
Additionally, the productivity of crypto-native assets has exceeded that of RWAs on a couple fronts. We covered this in our December 1 newsletter in the case of Maker and DAI, where crypto-backed loans achieved higher stability fees than that of RWAs. This dynamic still stands and has grown wider as MakerDAO voted to increase the stability fees of some of its on-chain vaults. Most notably, it increased the fee to mint DAI through one of its stETH vaults by 191 basis points. It is also present in the supply APYs of leading stablecoins relative to T-Bill yields. The chart below takes the weighted average supply APY by amount borrowed of USDT, USDC, DAI, and FRAX across Aave v2/v3 and Compound v2/v3. Stablecoin yields have consistently exceeded that of 3-month T-Bills since late October 2023/ early November 2023, just before DAI RWA collateral began its descent.
DeFi Users and Retention
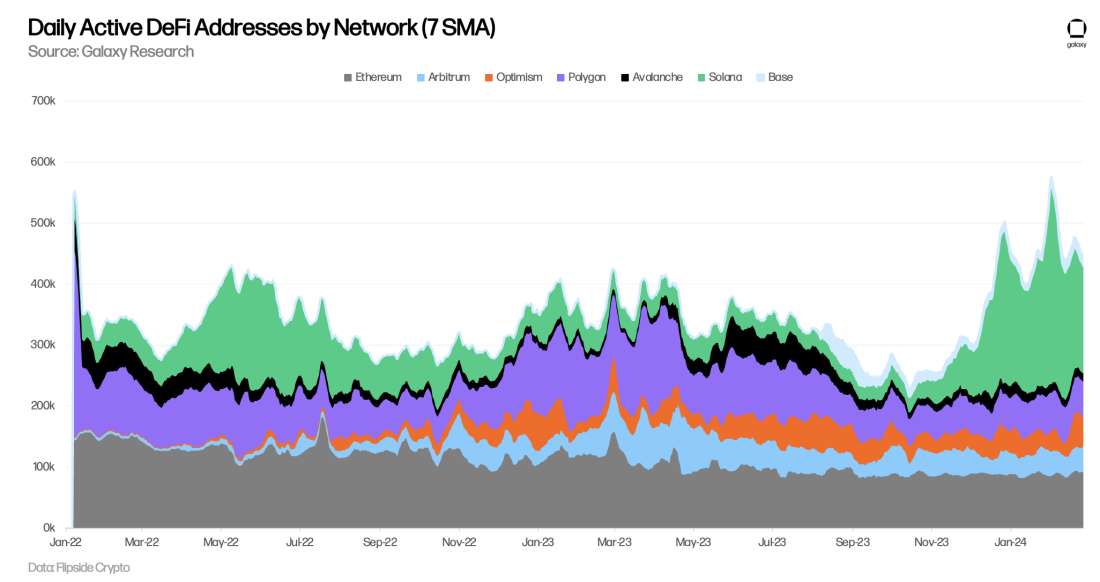
The number of daily active addresses (DAA) using DeFi across major L1s and L2s made new 2-year highs at 576k addresses on February 1 using the 7-day SMA. Solana has maintained the most daily active DeFi addresses, standing at 196k as of February 20, 2024 after reaching a high of 330k on February 1, 2024 (the day after the Jupiter airdrop). Ethereum, on the other hand, has been hemorrhaging DeFi users over the last year (down 24% from 120k addresses on February 20, 2023). More color on Ethereum activity and user counts will be covered in the next section.
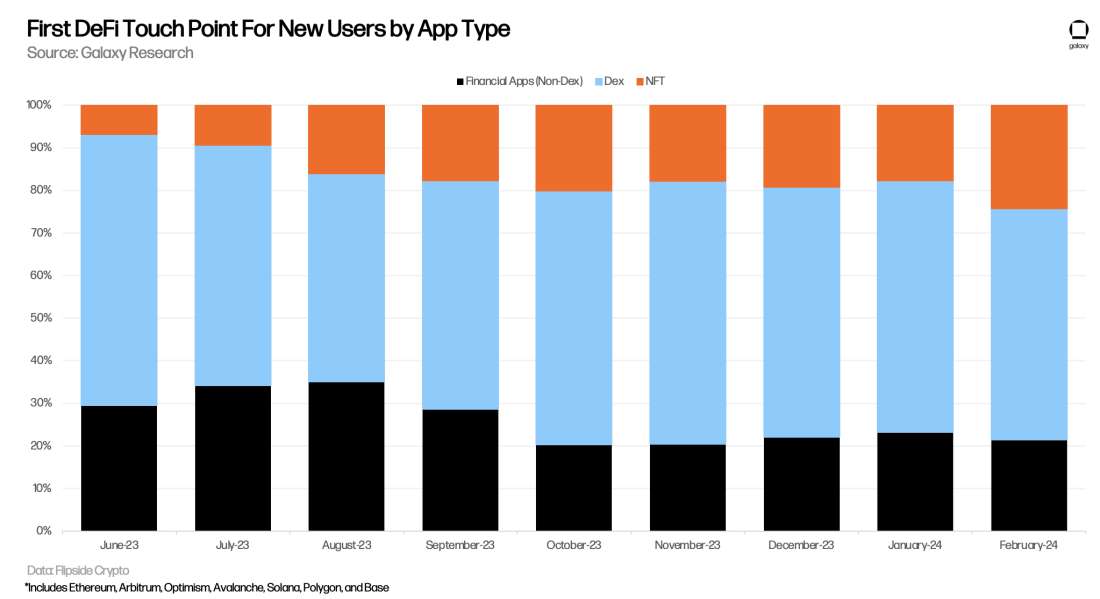
Dexes have become a key component for users joining DeFi on the seven chains observed above. For reference, in the chart below, the financial app category includes apps like lending platforms and yield aggregators. Almost 60% of all new users participating in DeFi on the seven chains started with dexes since September 2023. This is consistent with airdrops and waves of speculation that have encased DeFi over the last six plus months. Also, note the growing prominence of NFTs in onboarding new users into DeFi over the last three months.
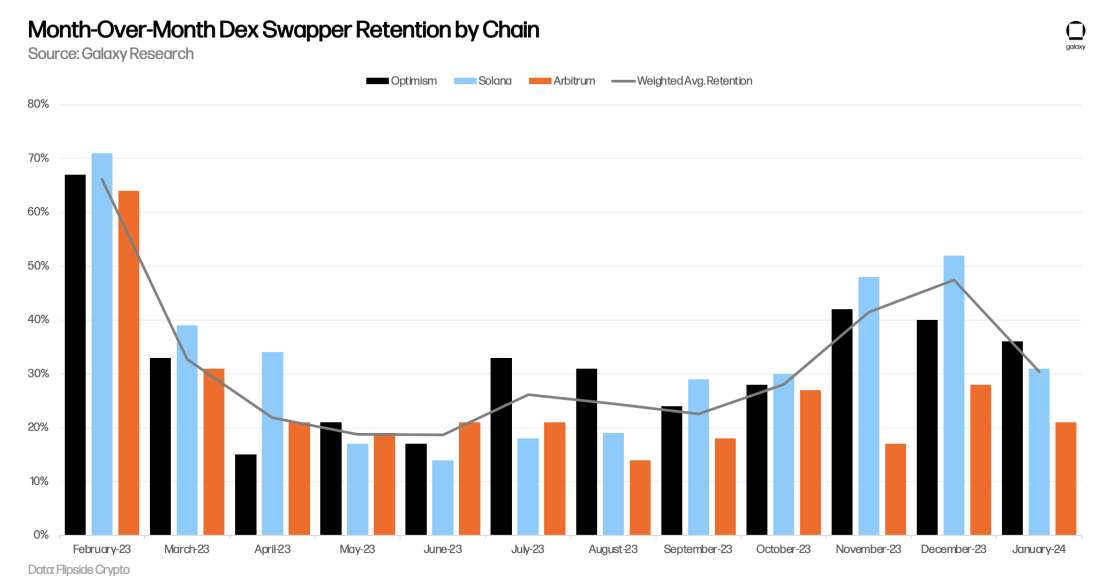
Retention among dex users was notably strong in the three months leading into January. Solana experienced the greatest retention of dex users in the chains observed over the last five months, which can be attributed to Jupiter’s airdrop campaign. The chart below tracks the month-over-month retention (retention of users joining in month x and still transacting in month x + 1) of dex users across Solana, Arbitrum, and Optimism, the top three chains for dex retention of the chains mentioned above. Month-over-month retention of these users had been trending higher for four consecutive months (six in the case of Solana) before declining in January 2024. The weighted average retention is based on new monthly dex users.
Ethereum and Layer 2s
Ethereum has been receiving criticism for declining user counts and general activity across Crypto Twitter. While it is true that daily active address count and activity metrics, like transaction count, have been flat to slightly down for much of the last two years, Ethereum’s commitment to a rollup centric future makes it unfair to measure Ethereum solely through the lens of its L1. When taking into consideration some of its top Layer 2s (L2s), user growth and activity are pressing against all-time highs.
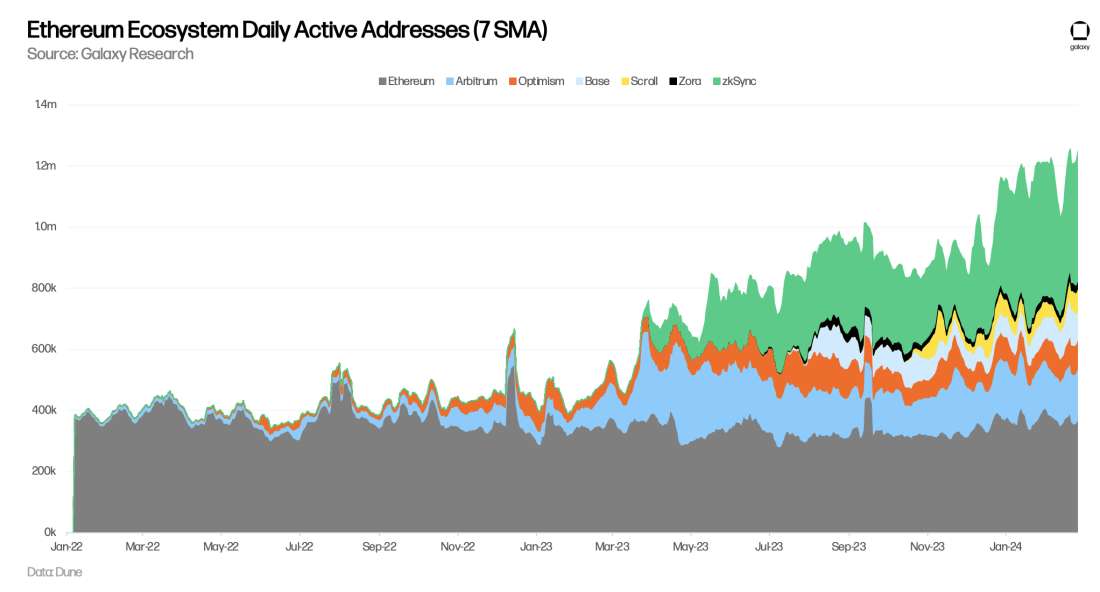
The chart below shows the combined network-wide daily active addresses of Ethereum L1 and some of its leading L2s. As of February 21, these networks combine for more than 1.2m daily active addresses, of which Ethereum L1 occupies only 360k addresses. Note, this chart only includes a portion of all Ethereum L2s.
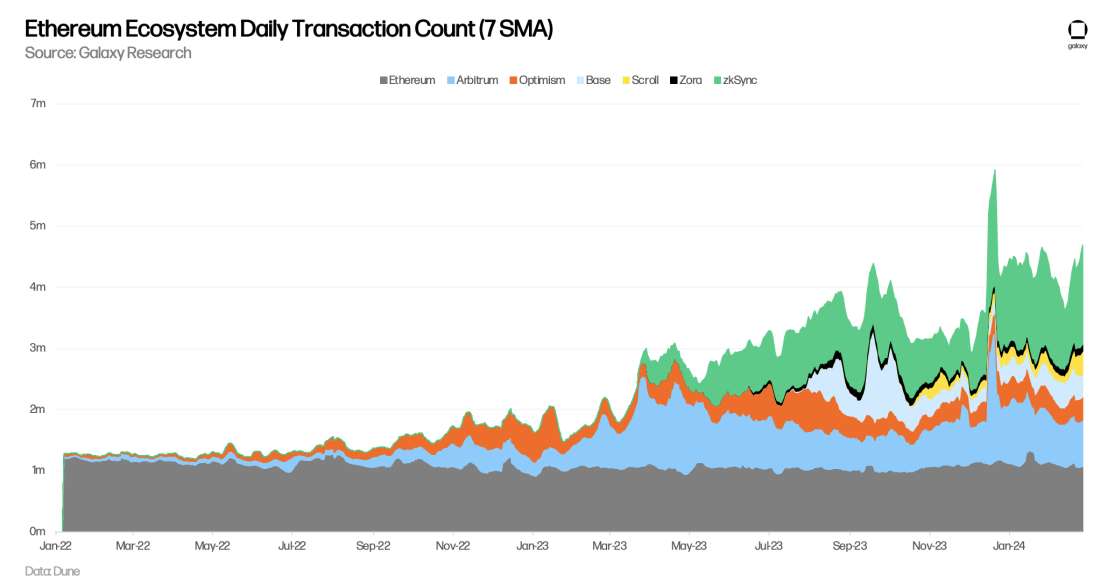
Transaction counts on Ethereum and the same L2s show similar highs. While Ethereum L1 transactions are sluggish, its ecosystem of L2s is averaging 3.14m transactions per day over the 30-day period ending February 26, 2024.
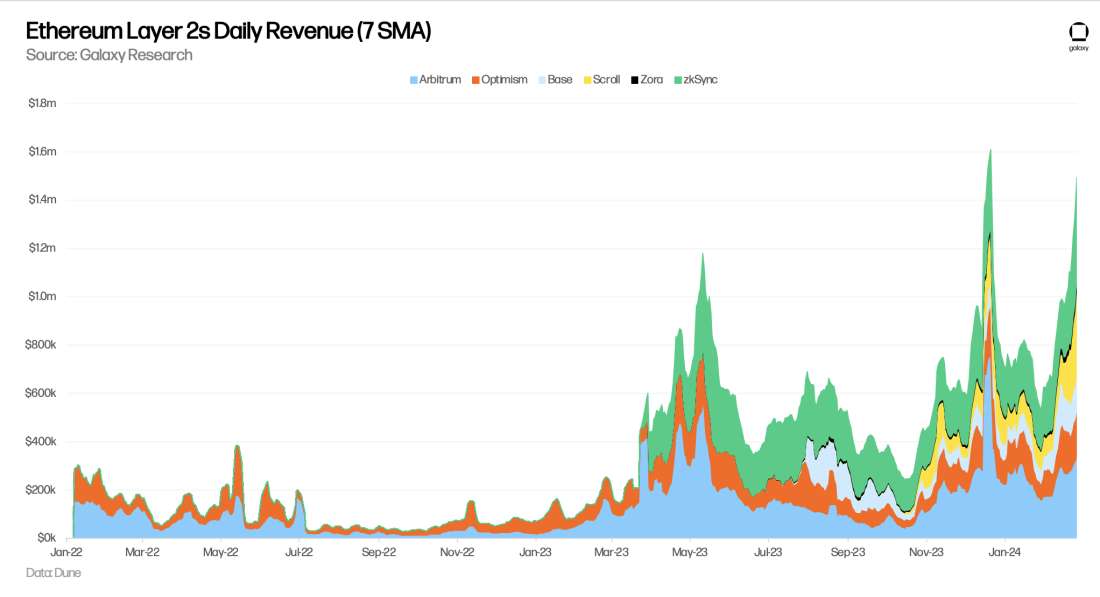
Coinciding with the strong transaction counts are expanding revenues. As of February 26, 2024 Arbitrum, Optimism, Base, Scroll, Zora, and zkSync are generating $1.5m in daily revenue using the 7-day SMA (these are fees paid by users to the rollup sequencer). February 26, 2024 also marked the second highest combined daily revenue for the observed chains.
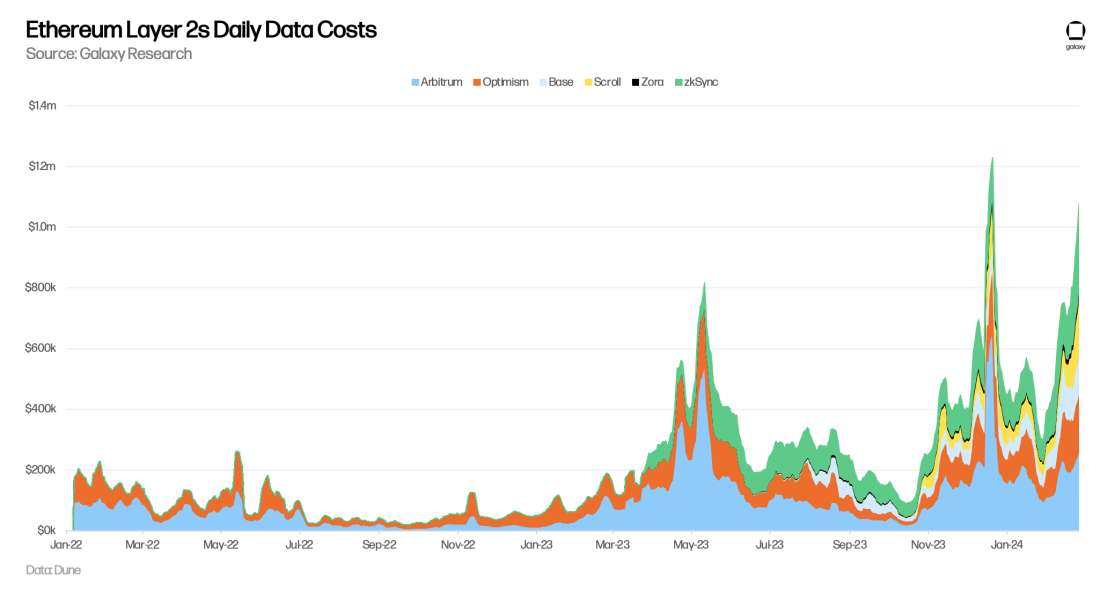
These same L2s have also paid more than $21.6m to Ethereum L1 in data costs over the 30-day period ending February 26, 2024. This figure will be increasingly important to watch as activity that would have previously been carried out on Ethereum L1 is executed on rollups.
Signal and Takeaways
The following are some key signals offered by the data above:
Sustained signs of demand for crypto-native assets in place of RWAs in DeFi remain persistent.
Users continue to flock to DeFi even as big airdrops have concluded, however, retention in dexes dropped in January. This suggests some churn or capitulation of users in this area of DeFi.
While it has been noted that there are declines in activity and user counts on Ethereum, its ecosystem of L2s remains vibrant with transaction counts pressing against all-time highs.
Legal Disclosure:
This document, and the information contained herein, has been provided to you by Galaxy Digital Holdings LP and its affiliates (“Galaxy Digital”) solely for informational purposes. This document may not be reproduced or redistributed in whole or in part, in any format, without the express written approval of Galaxy Digital. Neither the information, nor any opinion contained in this document, constitutes an offer to buy or sell, or a solicitation of an offer to buy or sell, any advisory services, securities, futures, options or other financial instruments or to participate in any advisory services or trading strategy. Nothing contained in this document constitutes investment, legal or tax advice or is an endorsementof any of the digital assets or companies mentioned herein. You should make your own investigations and evaluations of the information herein. Any decisions based on information contained in this document are the sole responsibility of the reader. Certain statements in this document reflect Galaxy Digital’s views, estimates, opinions or predictions (which may be based on proprietary models and assumptions, including, in particular, Galaxy Digital’s views on the current and future market for certain digital assets), and there is no guarantee that these views, estimates, opinions or predictions are currently accurate or that they will be ultimately realized. To the extent these assumptions or models are not correct or circumstances change, the actual performance may vary substantially from, and be less than, the estimates included herein. None of Galaxy Digital nor any of its affiliates, shareholders, partners, members, directors, officers, management, employees or representatives makes any representation or warranty, express or implied, as to the accuracy or completeness of any of the information or any other information (whether communicated in written or oral form) transmitted or made available to you. Each of the aforementioned parties expressly disclaims any and all liability relating to or resulting from the use of this information. Certain information contained herein (including financial information) has been obtained from published and non-published sources. Such information has not been independently verified by Galaxy Digital and, Galaxy Digital, does not assume responsibility for the accuracy of such information. Affiliates of Galaxy Digital may have owned or may own investments in some of the digital assets and protocols discussed in this document. Except where otherwise indicated, the information in this document is based on matters as they exist as of the date of preparation and not as of any future date, and will not be updated or otherwise revised to reflect information that subsequently becomes available, or circumstances existing or changes occurring after the date hereof. This document provides links to other Websites that we think might be of interest to you. Please note that when you click on one of these links, you may be moving to a provider’s website that is not associated with Galaxy Digital. These linked sites and their providers are not controlled by us, and we are not responsible for the contents or the proper operation of any linked site. The inclusion of any link does not imply our endorsement or our adoption of the statements therein. We encourage you to read the terms of use and privacy statements of these linked sites as their policies may differ from ours. The foregoing does not constitute a “research report” as defined by FINRA Rule 2241 or a “debt research report” as defined by FINRA Rule 2242 and was not prepared by Galaxy Digital Partners LLC. For all inquiries, please email [email protected]. ©Copyright Galaxy Digital Holdings LP 2024. All rights reserved.