


Looking Beyond the Bitcoin Selloff

Bitcoin’s price declined from an all-time high of $64,900 on Wednesday to an intraday low $51,707 on early Sunday.
Key Takeaways
Bitcoin’s run higher had likely been partially fueled by the COIN headlines and an over leveraged market (as indicated by basis levels). The price momentum was corrected this weekend. As the saying goes, “the faster the rise, the harder the fall.” As the fundamentals remain strong, there are clear indications of a potential price retracement and trading should be managed accordingly.
Weekend Overview
Price Action. On Wednesday April 15th, Bitcoin rose to new all-time highs in advance of the Coinbase (COIN) direct listing. It appeared as if Bitcoin investors were “buying the rumor” and “selling the news” with Bitcoin rising into the direct listing before receding as Coinbase trading progressed. Ultimately, Coinbase retreated from its intraday high of $110bn market cap to close the week at $63bn and Bitcoin reacted similarly, slipping from its new all-time-high just shy of $65k (red line in chart below) into the low $60k range Friday. Early Sunday morning, a selloff pushed Bitcoin down into the low $50k range.
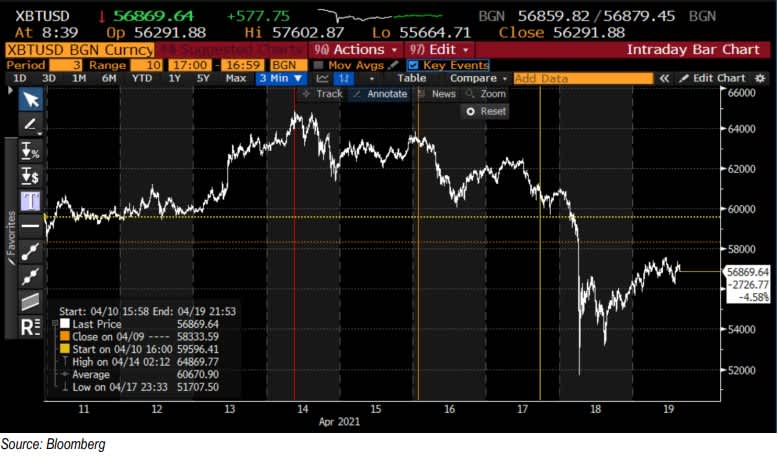
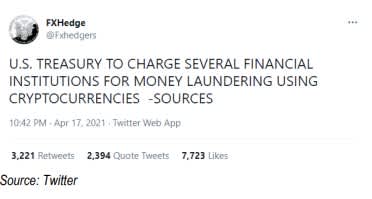
Observers pointed to several factors as precipitating the decline, including an unsourced and still uncorroborated tweet from an anonymous news account called “FXHedgers” announcing that U.S (yellow line in chart above). Treasury officials would soon charge financial institutions for enabling money laundering via crypto.
Although the U.S. Treasury did issue a press release announcing new sanctions against the Russian government Thursday which mentioned the use of cryptocurrency for illicit transactions (orange line in chart above), there’s no indication that was the basis for the Tweet. While Janet Yellen has previously acknowledged the need to curtail any possible money laundering through digital assets, we’ve seen no news to substantiate the widely shared Tweet.
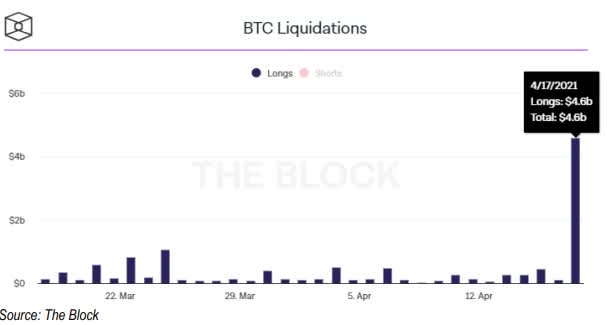
Liquidations. The price drop wiped out $4.6bn of leveraged long positions, according to data from The Block.
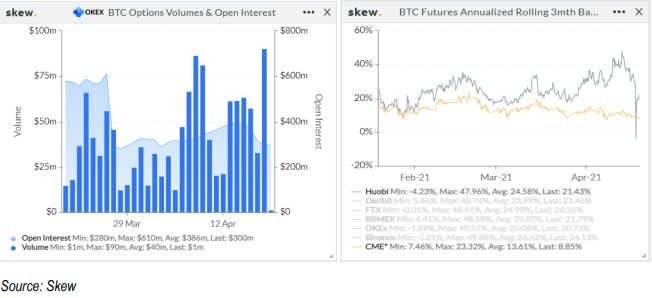
Futures/options. Options volumes on Sunday, April 14th were $90mm, almost 2.5x much as a normal day’s and significantly greater than the $10-30mm range for volumes typical of the last few Sundays. Open interest has maintained near the lower end of the average range at ~$300mm. After funding had consistently remained elevated the last few weeks, basis has finally cooled. CME rolling 3-month leveled off, while Huobi rolling 3mth temporarily went negative, demonstrating a pullback in investor desire for leverage.
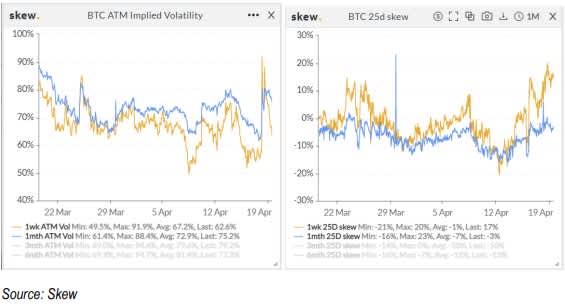
Vols. 1-week implied vols saw the biggest increase on Sunday, April 17, up from ~57 to ~91, and now hovering around 63 last. While the temporary jump to around 90 may seem high, implied volatility was at these levels less than one month ago. 1-month saw a slight uptick to ~80 and it has hovered around high 70s since. Preference for topside has come off as depicted by the chart below measuring put minus call skew. Most notably, 1-week downside now shows a premium for puts, as investors have been driven to put on protection.
Signs this Bull Market Still Has Legs
While not necessarily predictive, examining data from the blockchain can reveal patterns in user behavior and identify insights that can inform trading strategies. Below, we share several analyses that suggest this bull market still has legs.
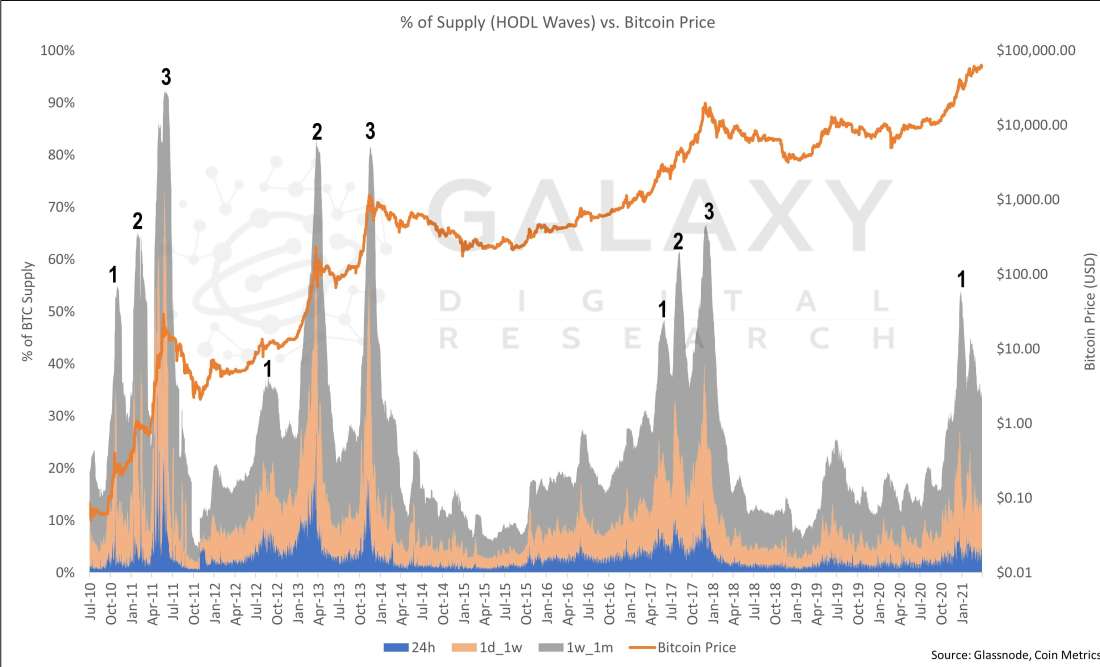
Cyclical coin activity shows bull market is in early stages. Highlighting the activities of coins last moved in the previous 24 hours, week, and month shows a clear pattern leading into each prior price peak. In each cycle, the market top coincided with the last of 3 spikes in activity from these coins. The historical data suggests that any market top in this bull cycle should be preceded by at least 2 more peaks in short-term coin movement.
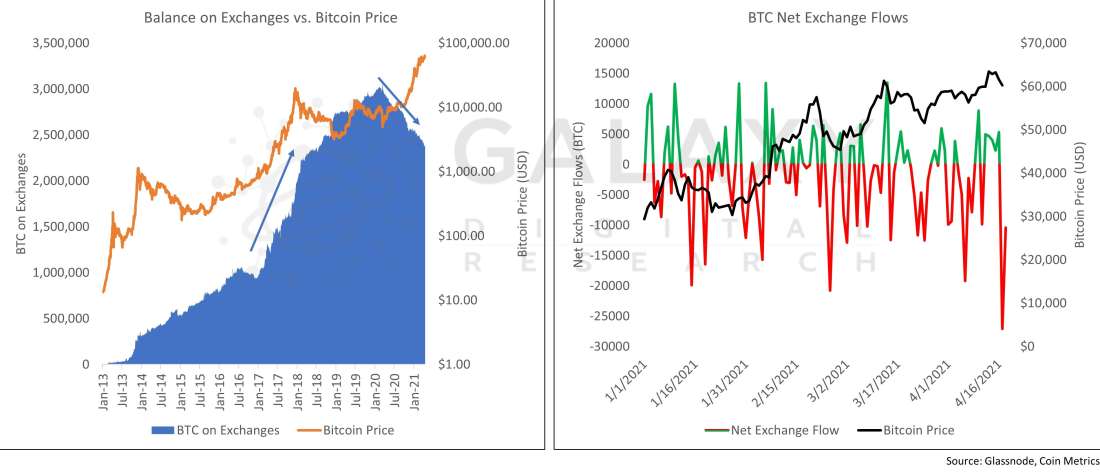
Exchange balances keep declining. A phenomenon new to this cycle is the decline of bitcoin held in exchange wallets. In prior cycles, particularly 2017, the balance held by exchanges rose into the market top. Indeed, the amount of BTC held on exchanges rose consistently through 2017 and peaked in March 2020. Since then, however, the amount of BTC held on exchanges has consistently declined even as price has risen, suggesting that purchasers are putting their coins in long-term cold storage. Exchange outflows have continued throughout 2021, including during last weekend’s dip.
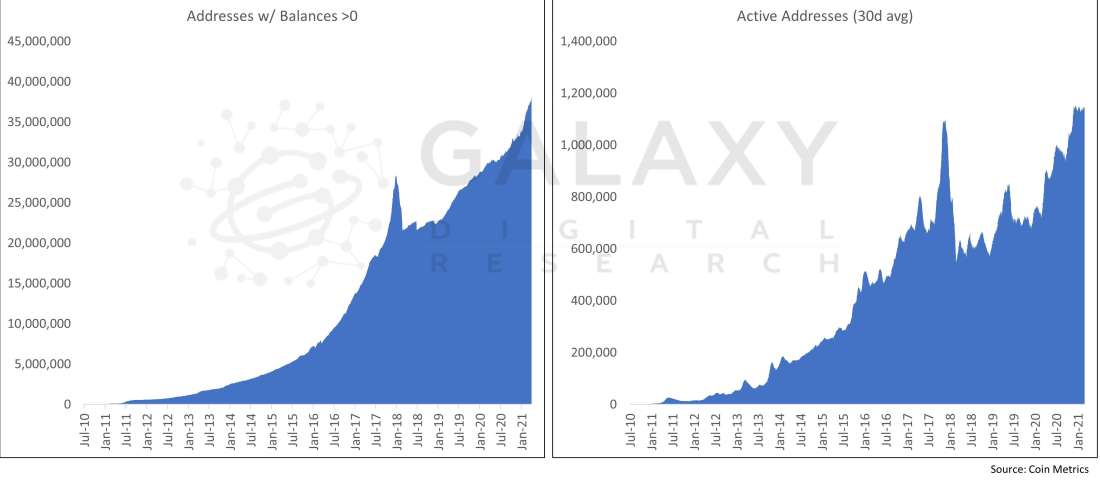
Bitcoin use and ownership is growing. Broadly speaking, Bitcoin usage continues to increase. The number of addresses with any balance continues to make all-time highs, and daily activity remains at its highest levels ever. (Note, we show the active addresses with a 30d average due to significant daily variance).
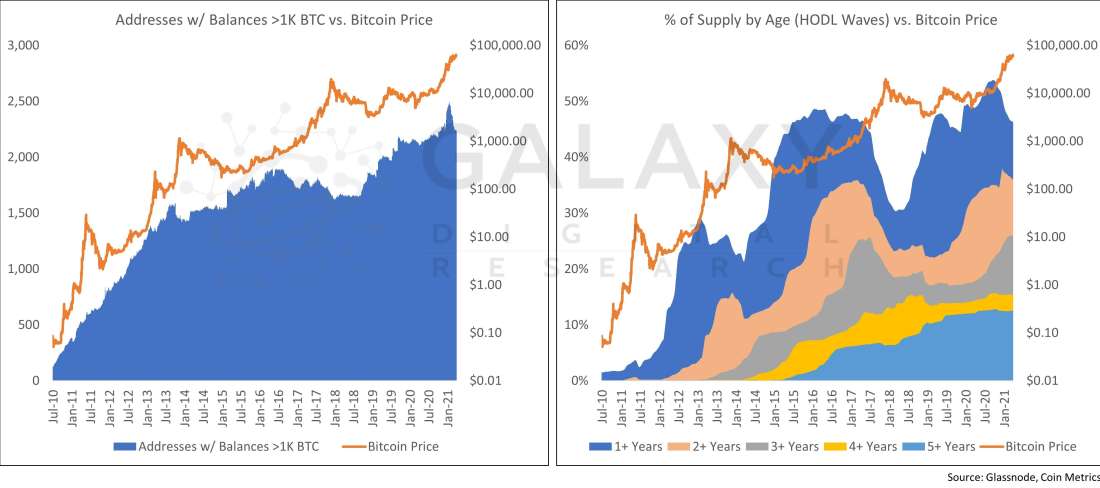
Long term holders are accumulating. On-chain data shows that the number of long-term holders is growing and that they are increasing their holdings. The number of addresses with >1K BTC has risen consistently since the 2017 market top and is near alltime highs. Examining the distribution of Bitcoin’s total supply based on “age bands,” or the various intervals in which coins have moved, also shows that longer term holders are accumulating. A greater share of coins has not moved in each of the in 2+, 3+, 4+, and 5+ year bands than ever before. Despite a recent decline in younger coins, which also occurred well before the 2017 market top, we continue to see consistent growth in the supply of coins in older age bands.
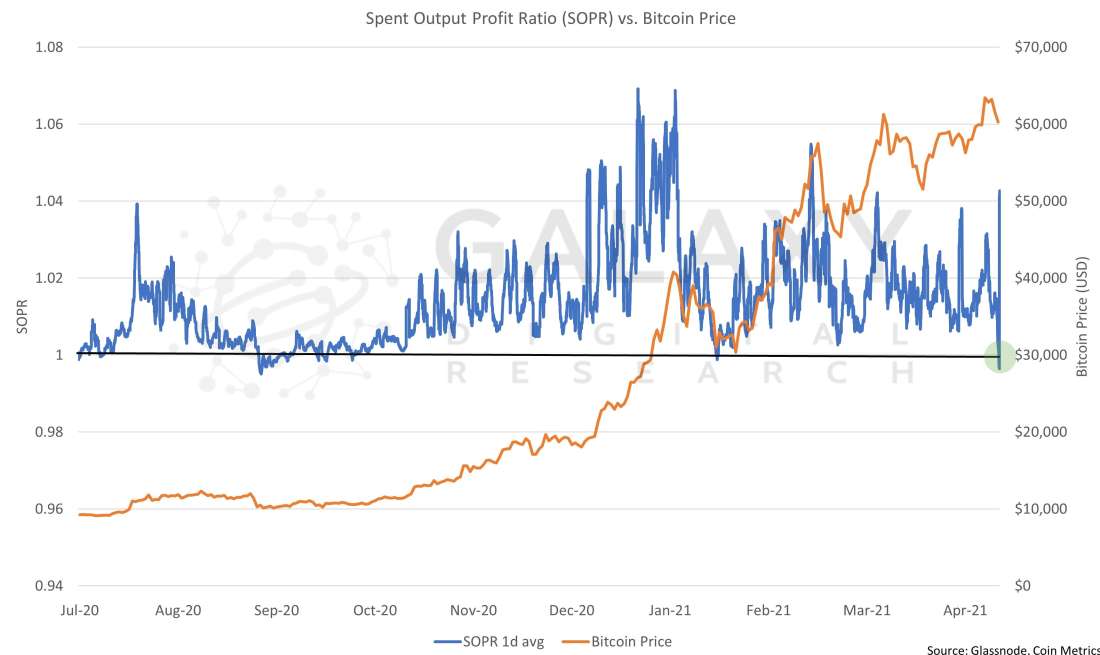
Coin movements show the dip is worth buying. Looking at the ratio of spent coins in profit vs. spent coins in loss shows a reset as occurred. Essentially, this metric shows the ratio of price sold vs. price paid. When SOPR is greater than 1, the spent coins are in profit (higher than their prior move), else they are at a loss. Historically, a SOPR above 1 is rejected in bear markets and a SOPR below 1 is rejected during bull markets. Thus, the indicator can be useful to identify local tops and bottoms. In this case, the dip to 1 suggests a local bottom.
Legal Disclosure:
This document, and the information contained herein, has been provided to you by Galaxy Digital Holdings LP and its affiliates (“Galaxy Digital”) solely for informational purposes. This document may not be reproduced or redistributed in whole or in part, in any format, without the express written approval of Galaxy Digital. Neither the information, nor any opinion contained in this document, constitutes an offer to buy or sell, or a solicitation of an offer to buy or sell, any advisory services, securities, futures, options or other financial instruments or to participate in any advisory services or trading strategy. Nothing contained in this document constitutes investment, legal or tax advice or is an endorsement of any of the stablecoins mentioned herein. You should make your own investigations and evaluations of the information herein. Any decisions based on information contained in this document are the sole responsibility of the reader. Certain statements in this document reflect Galaxy Digital’s views, estimates, opinions or predictions (which may be based on proprietary models and assumptions, including, in particular, Galaxy Digital’s views on the current and future market for certain digital assets), and there is no guarantee that these views, estimates, opinions or predictions are currently accurate or that they will be ultimately realized. To the extent these assumptions or models are not correct or circumstances change, the actual performance may vary substantially from, and be less than, the estimates included herein. None of Galaxy Digital nor any of its affiliates, shareholders, partners, members, directors, officers, management, employees or representatives makes any representation or warranty, express or implied, as to the accuracy or completeness of any of the information or any other information (whether communicated in written or oral form) transmitted or made available to you. Each of the aforementioned parties expressly disclaims any and all liability relating to or resulting from the use of this information. Certain information contained herein (including financial information) has been obtained from published and non-published sources. Such information has not been independently verified by Galaxy Digital and, Galaxy Digital, does not assume responsibility for the accuracy of such information. Affiliates of Galaxy Digital may have owned or may own investments in some of the digital assets and protocols discussed in this document. Except where otherwise indicated, the information in this document is based on matters as they exist as of the date of preparation and not as of any future date, and will not be updated or otherwise revised to reflect information that subsequently becomes available, or circumstances existing or changes occurring after the date hereof. This document provides links to other Websites that we think might be of interest to you. Please note that when you click on one of these links, you may be moving to a provider’s website that is not associated with Galaxy Digital. These linked sites and their providers are not controlled by us, and we are not responsible for the contents or the proper operation of any linked site. The inclusion of any link does not imply our endorsement or our adoption of the statements therein. We encourage you to read the terms of use and privacy statements of these linked sites as their policies may differ from ours. The foregoing does not constitute a “research report” as defined by FINRA Rule 2241 or a “debt research report” as defined by FINRA Rule 2242 and was not prepared by Galaxy Digital Partners LLC. For all inquiries, please email [email protected]. ©Copyright Galaxy Digital Holdings LP 2022. All rights reserved.